EducationSoftwareStrategy.com
StrategyCommunity

Knowledge Base

Product

Community

Knowledge Base

TopicsBrowse ArticlesDeveloper Zone

Product

Download SoftwareProduct DocumentationSecurity Hub

Education

Tutorial VideosSolution GalleryEducation courses

Community

GuidelinesGrandmastersEvents
x_social-icon_white.svglinkedin_social-icon_white.svg
Strategy logoCommunity

© Strategy Inc. All Rights Reserved.

LegalTerms of UsePrivacy Policy
  1. Home
  2. Topics

KB36339: Metric subtotals are not calculated correctly when the second display option is applied to custom group in MicroStrategy Analytical Engine


Community Admin

• Strategy


This article notes an issue with custom group subtotals with level metrics

SYMPTOM:
In Strategy, when a report contains a custom group and the display option is set to the second one “Show only the individual items within this element”, the metric subtotals are not calculated correctly.
 
STEPS TO REPRODUCE:
Follow steps below to reproduce the issue with Strategy Tutorial project:
 

ka04W000000OhR1QAK_0EM440000002Dkj.png


  1. In Strategy Developer, create a custom group and add a condition Month in list 'Jan 2007, Feb 2007', as shown below: 
  2. Right click the custom group element name and choose “Show display option”.
  3. Choose the second option in the display option window, as shown below:
ka04W000000OhR1QAK_0EM440000002Dkd.png


  •  Create a metric Revenue, set the attribute Brand and Month as target level, as shown below:
ka04W000000OhR1QAK_0EM440000002Dkl.png


ka04W000000OhR1QAK_0EM440000002Dkr.png


ka04W000000OhR1QAK_0EM440000002DkW.png


ka04W000000OhR1QAK_0EM440000002Dkp.png


ka04W000000OhR1QAK_0EM440000002Dkh.png


ka04W000000OhR1QAK_0EM440000002Dkc.png

 
CAUSE:
 This is a known issue in Strategy Analytical Engine.
 
ACTION:
Currently this issue is still being reviewed for feasibility by our Technology team and it is not scoped for any upcoming scheduled Strategy release. 
 
WORKAROUND:
 Use the first and fourth display option when creating custom groups. 
 

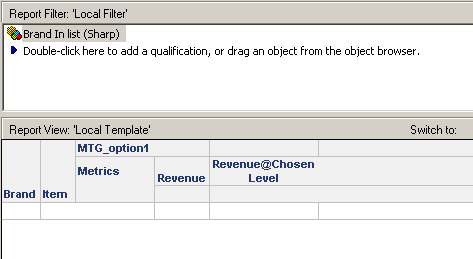
  • Create a report with the attribute Brand and Item in the row, custom group, Revenue and the new metric created in the above step in the column, add a report filter “Brand in list Sharp”, as shown below:  
  •  Run the report and it shows correct results, as shown below: 
ka04W000000OhR1QAK_0EM440000002Dkn.png
  •  Go to Data menu and add Total subtotal to the report as shown below:
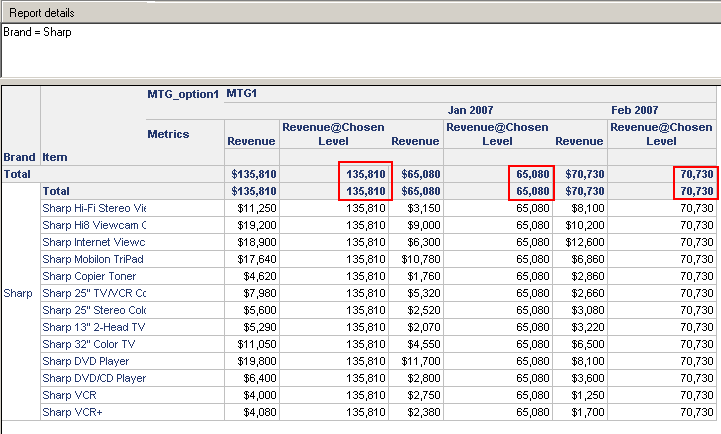
  •  The subtotal for metric “Revenue@Chosen level” is not showing the correct result, as shown below:
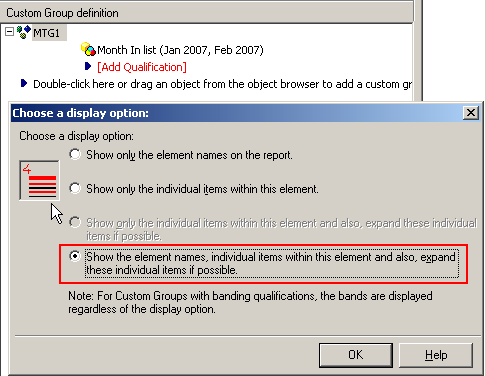
  • When choosing other display options except the second one, the report result is correct. Edit the custom group and set the display option to the last one as shown below:
  •  Close the report and run again. The subtotal for metric “Revenue@Chosen level” is showing the correct result, as shown below: 
     
ka04W000000OhR1QAK_0EM440000002DkZ.png
  • Edit the custom group and set the display option to the first one as shown below:
  •  Close the report and run again. The subtotal for metric “Revenue@Chosen level” is showing the correct result as shown below:
     
ka04W000000OhR1QAK_0EM440000002Dkf.png

Comment

0 comments

Details

Knowledge Article

Published:

May 19, 2017

Last Updated:

May 19, 2017