SYMPTOM
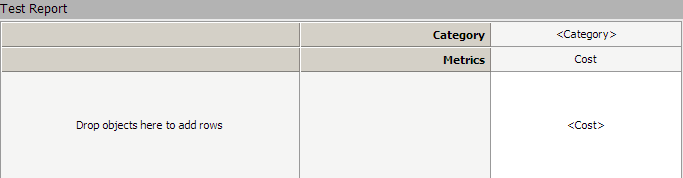
A user creates a Pie chart in Strategy Web 9.x. by placing both the desired attribute and metric into the columns, as shown below.
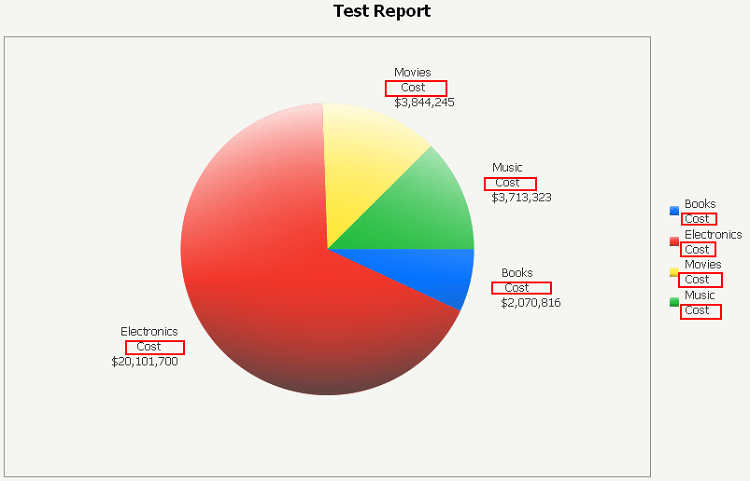
This creates a pie chart that displays the metric name(s) in all of the data labels, as shown below.
CAUSE
This is working as designed. When an attribute is placed into the columns above the metrics, it is considered a cross-tab attribute. For each cross-tab attribute element combination, there could be more than 1 metric and it becomes necessary to identify the metric in the legend. However, under the 1 metric scenario, it is irrelevant.
ACTION
Follow these design changes to format the pie chart correctly.
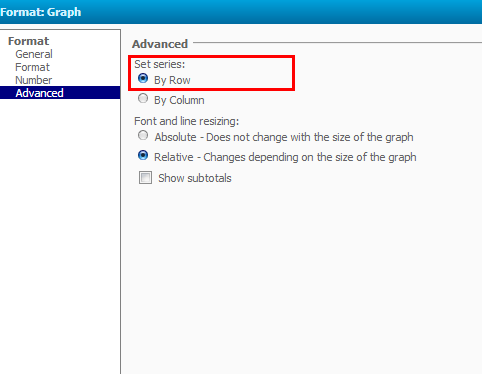
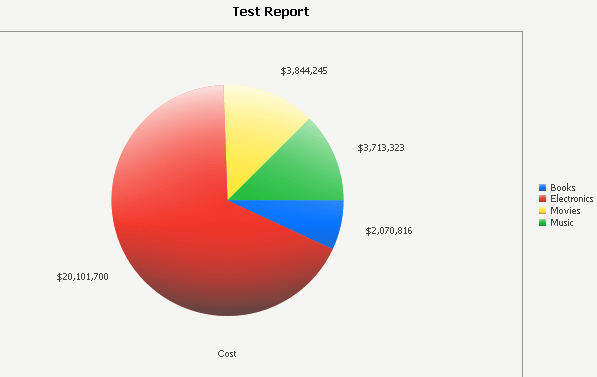
Alternatively, if the metrics were moved to the rows and the attribute kept in the columns, due to the fact that the default setting for the "Set Series" property is "By Column", the design shown below:
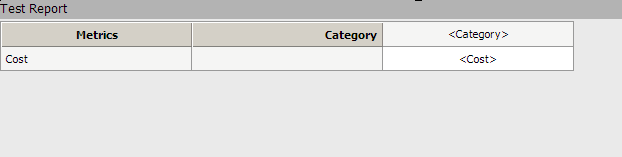
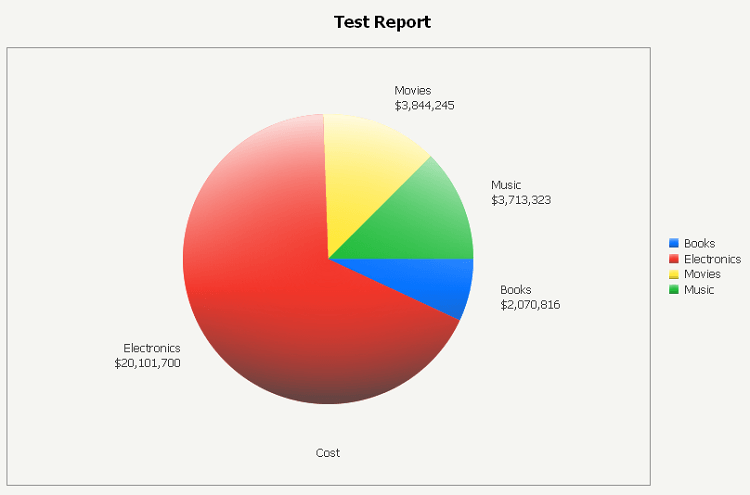
Will produce the following pie chart:
Article Reference Number: KB3645
