SYMPTOM:
If the operator of the Custom Group elements is set to OR or OR NOT, when using a Custom Group in a Dataset of a Report Services Document running in Flash view mode, an empty extra cell is shown:

This issue happens in Developer and Web, regardless of the "Show Display Options" option in the Custom Group definition or the "Remove extra column (web only)" option defined in the report settings.
STEPS TO REPRODUCE:
1. Using the Strategy Tutorial project in Developer or Web, create a Custom Group object with the following definition:

Notice that the “OR” operator is being used between the two conditions in the Custom Group definition.
2. Create a report from scratch and place the newly created Custom Group object on its template. Save and close this report.
3. Create a new dashboard using the newly created report as the dataset and add a grid with this report to the dashboard panel.
4. Edit the Grid Options and check the option “Fit to Window” under the tab Columns and Rows:
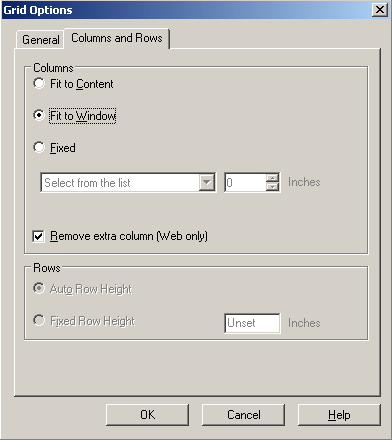
5. Run the new dashboard in Flash view mode, so an extra cell is shown in the grid report:

6. Save the dashboard.
7. Edit the Custom Group object and toggle the operator between the conditions to “AND” and save it:

8. Run the dashboard in Flash view mode again to see that no extra cell is shown:

CAUSE:
This issue occurs due to a known issue.
ACTION:
Strategy will continue to investigate and post updates as soon as they are available.
WORKAROUND:
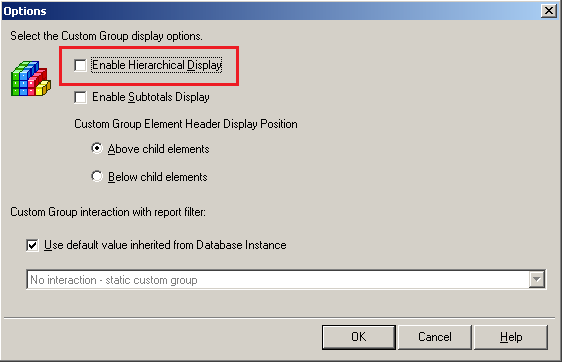
Edit the Custom Group object using the main menu bar. Click on Custom Group > Options and uncheck the box "Enable Hierarchical Display":
KB36810
