EducationSoftwareStrategy.com
StrategyCommunity

Knowledge Base

Product

Community

Knowledge Base

TopicsBrowse ArticlesDeveloper Zone

Product

Download SoftwareProduct DocumentationSecurity Hub

Education

Tutorial VideosSolution GalleryEducation courses

Community

GuidelinesGrandmastersEvents
x_social-icon_white.svglinkedin_social-icon_white.svg
Strategy logoCommunity

© Strategy Inc. All Rights Reserved.

LegalTerms of UsePrivacy Policy
  1. Home
  2. Topics

KB36931: When using custom selected colors for a Graph, the selected color changes are not applied in MicroStrategy Developer 10.x


Stefan Zepeda

Salesforce Solutions Architect • Strategy


When trying to select separate colors for each bar in a graph through ‘Color by Categories’ Graph Options, the custom selected colors are not applied when ‘Set Series by Columns’ in MicroStrategy Developer 10.x

SYMPTOM:
When trying to select separate colors for each bar in a graph through ‘Color by Categories’ Graph Options, the custom selected colors are not applied when ‘Set Series by Columns’ in Strategy Developer 10.x
STEPS TO REPRODUCE:

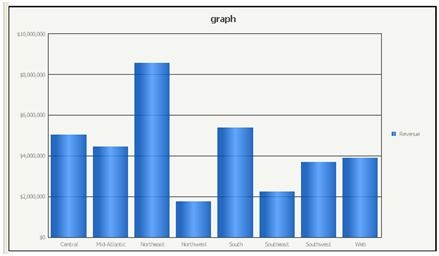
  • Create a report with one attribute and one metric.
  • Run the report and view as vertical bar graph
  • Go to Graph Preferences and change the colors to custom  and add a selection of colors for each x-axis value as shown in the image below and click OK.  
ka02R000000kc3AQAQ_0EM440000002Dfc.jpeg
  • Once you click Apply and OK, notice the colors do not change to the custom selected colors in the graph .
ka02R000000kc3AQAQ_0EM440000002DfY.jpeg

CAUSE:
This is a known Issue in Strategy Developer 10.x
ACTION:
Strategy will continue to investigate and post updates as soon as they are available.
WORKAROUND:

  • At the top toolbars notice that 'Set Series by Column' icon is selected.
ka02R000000kc3AQAQ_0EM440000002Dfa.jpeg
  • Select the one next to it to 'Set Series by Row'.
  • Go to Graph Options - Color and select the previously selected color series (making sure colors are reselected or edited).
  • Click OK and switch back to 'Set Series by Column'. This should make the color series you selected appear on your graph as seen below.
ka02R000000kc3AQAQ_0EM440000002Dfe.jpeg

Comment

0 comments

Details

Knowledge Article

Published:

May 31, 2017

Last Updated:

May 31, 2017