The following steps describe applying threshold color on Map widget when running a Report Services document with Strategy Tutorial project in Strategy Web 9.x:

6. Choose the radio button "Use dynamic bubbles" under Marker style/mode section and check the "Apply threshold for the map" box, as shown below:

7.Run the document in Edit mode. Right click the metric Cost and select Thresholds>Advanced, add threshold on Cost value which will change the background color of cells, as shown below:
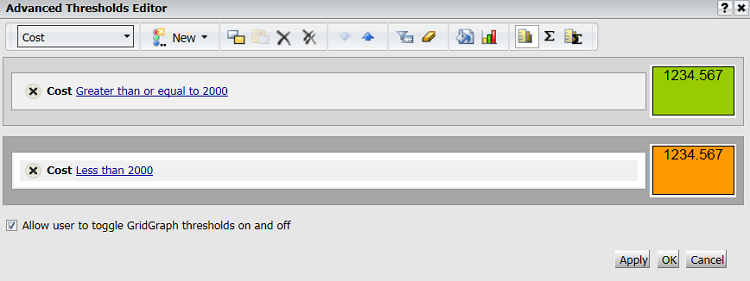
8.Run the document. Note that the threshold is applied, as shown below:

Note: At step 7, if using cells font color instead of background color when adding threshold color on metric value, as shown below:

Run the document, the dynamic bubbles will show as black ones, as shown below:

