EducationSoftwareStrategy.com
StrategyCommunity

Knowledge Base

Product

Community

Knowledge Base

TopicsBrowse ArticlesDeveloper Zone

Product

Download SoftwareProduct DocumentationSecurity Hub

Education

Tutorial VideosSolution GalleryEducation courses

Community

GuidelinesGrandmastersEvents
x_social-icon_white.svglinkedin_social-icon_white.svg
Strategy logoCommunity

© Strategy Inc. All Rights Reserved.

LegalTerms of UsePrivacy Policy
  1. Home
  2. Topics

KB38400: How to compare metric values by quarter in MicroStrategy Developer


Stefan Zepeda

Salesforce Solutions Architect • Strategy


How to compare metric values by quarter in MicroStrategy Developer

In some business scenarios, it is required to compare the metric value with previous quarter's. 
The technical note as below provides a method with using MovingSum() function and basic math operation. 
 
KB5504: How to create a derived metric that shows data from the previous row in MicroStrategy SQL Generation Engine
 
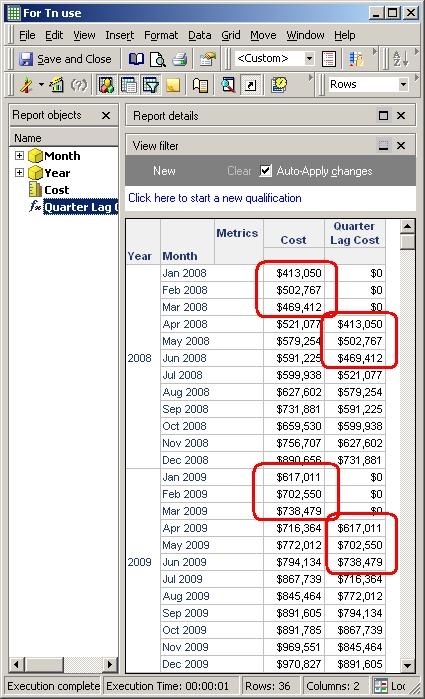
Another way to achieve this is using Lag() function. The Lag function is useful to display a set of metric values in an order determined by another metric or attribute on the report. It helps to compare metric values side-by-side. It is defined as
 
Sample Code/Error
Lag <BreakBy, SortBy> (Argument, Offset, DefaultValue)
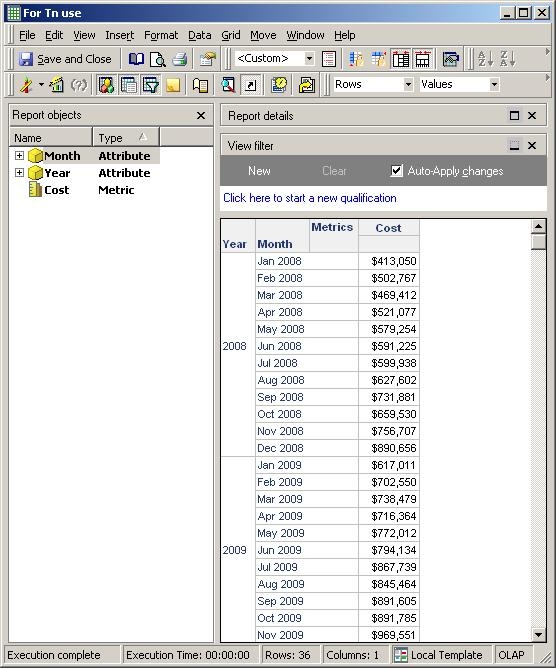
  • BreakBy is the attribute indicating where the calculation restarts.
  • SortBy is the attribute or metric by which the data is sorted.
  • Argument is an attribute or metric representing a list of values. It is common to use a metric for Argument.
  • Offset specifies the offset from the current row to display information for.
  • DefaultValue is the value displayed for any entries that do not have any data due to the offset. Usually enter Null or 0 as default value.

 
EXAMPLE:

  • Create a blank report in Strategy Tutorial project
  • Insert 2 attributes, "Year" and "Month," and 1 metric, "Cost"
  • Run the report, as shown below:
     
ka02R000000kbAEQAY_0EM440000002DRb.jpeg
  • Then insert a derived metric called "Quarter Lag Cost" with the following definition into the report.

    Sample Code/Error

    Lag<BreakBy={Year}, SortBy= (Month) >(Cost, 3.0, 0.0)


  • Run the report and the newly created metric return with one quater lag metric compared with the "Cost" metric, which is the expected result, as shown below:
ka02R000000kbAEQAY_0EM440000002DRZ.jpeg


Comment

0 comments

Details

Knowledge Article

Published:

June 8, 2017

Last Updated:

March 16, 2018