SYMPTOM:
In Strategy, there is no way to calculate subtotals from base for non-distributive base metrics. Subtotaling is performed by the Analytical Engine based on one level of result data retrieved via SQL. When calculating the subtotal at a higher level, it just uses the data retrieved for the lower level directly. Derived metrics have an option to do subtotal from base.
For example, in this report in Strategy Tutorial Project.
Attribute: Year, Category
Metric: M1=Count<Distinct=True, FactID=Cost, UseLookupForAttributes=False>(Customer)
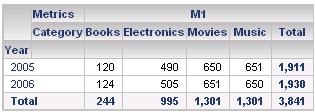
The total value 244 of Books is added by 120 and 124. But some customers both shop in 2005 and 2006 for Books, in fact there are 223 distinct customers.
CAUSE:
Distinct counts retrieved from the database cannot be re-aggregated to calculate a meaningful distinct count at a higher level – the higher level values must be calculated by performing another distinct count back against the source data.
The problem can be generalized to any metric that is non-distributive. Another example is the aggregation that uses proprietary statistical techniques (common in syndicated data for CPG manufacturers) – results at one level cannot be determined based on results from a lower level; the data must be retrieved from the database.
WORKAROUND:
A user can use level metric to display the data of different levels. The key point is how to display them properly on the same subtotal object.
For the same example above, first create four metrics to count distinct customers in different levels.
Then create some metrics to indicate the levels.
At last, create a metric with Case function to choose the right count metric according to the level. Mark this metric as Smart metric so the total is calculated first.
M5$ = Case(MI1 = 1, M1, MI1 = MI2 and MI1 <> MI4, M2, MI1 = MI3 and MI1 <> MI4, M3, M4)

With this method, the subtotal is calculated from base instead of the data in the view template.
415513 39073
