EducationSoftwareStrategy.com
StrategyCommunity

Knowledge Base

Product

Community

Knowledge Base

TopicsBrowse ArticlesDeveloper Zone

Product

Download SoftwareProduct DocumentationSecurity Hub

Education

Tutorial VideosSolution GalleryEducation courses

Community

GuidelinesGrandmastersEvents
x_social-icon_white.svglinkedin_social-icon_white.svg
Strategy logoCommunity

© Strategy Inc. All Rights Reserved.

LegalTerms of UsePrivacy Policy
  1. Home
  2. Topics

KB39385: Data label overlap on pie chart graph displaying in Visual Insight in MicroStrategy Web


Community Admin

• Strategy


Where there are too many elements in the Visual Insight pie graph, data labels will overlap.

SYMPTOM:
 
Where there are too many elements in the Visual Insight graph, data label will be overlapped. For example:
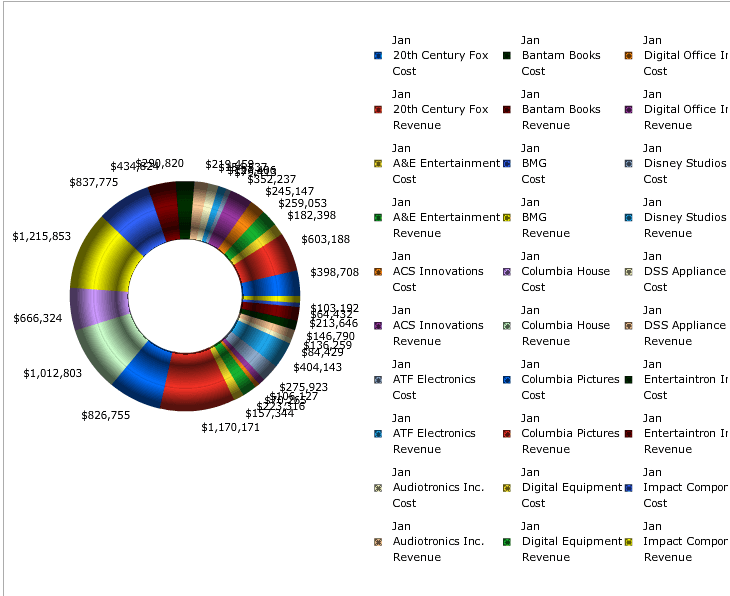
 

ka04W000000OdkRQAS_0EM4400000027GC.png

 
CAUSE:
This is a known issue with Visual Insight pie chart graph type in Strategy Web 9.x.
 
ACTION:
It was tested that in Strategy 10.x Visual Insight, which supports HTML5, data labels will not overlap each other. Some of them will be dropped if there is not enough space. Please upgrade to take advantage of this enhancement.
 
WORKAROUND:
Use a different graph type on Visual Insight or use regular Strategy report instead 


Comment

0 comments

Details

Knowledge Article

Published:

June 18, 2017

Last Updated:

June 18, 2017