SYMPTOM:
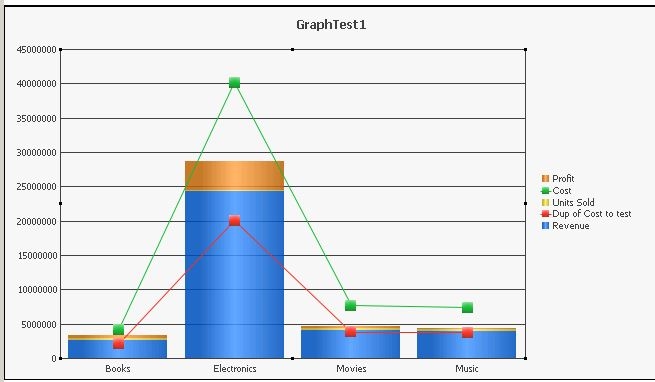
When a stack graph is created with two lines, the second line does not show the correct value. Strategy Tutorial project is used to explain this behavior.
STEPS TO REPRODUCE:
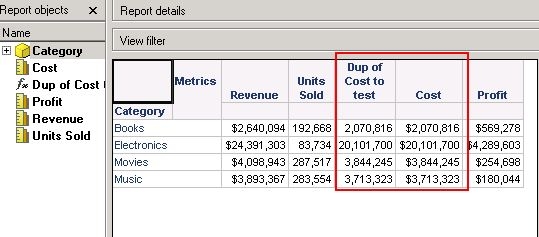
Execute the following in Strategy Tutorial:


CAUSE
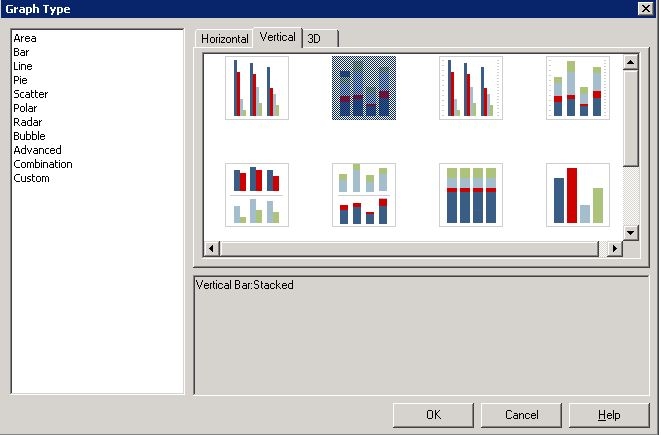
This is working by design. Currently, it is not possible to specify a different option for a different graph style. In this example, "Stacked" is selected for the entire graph, resulting the line for "Cost" metric to show stacked values instead of an absolute value.
ACTION
An enhancement request has been logged so that the layout option to specify a type can be defined for each chart type.
WORKAROUND 1:
Change the layout type to absolute.

WROKAROUND 2:
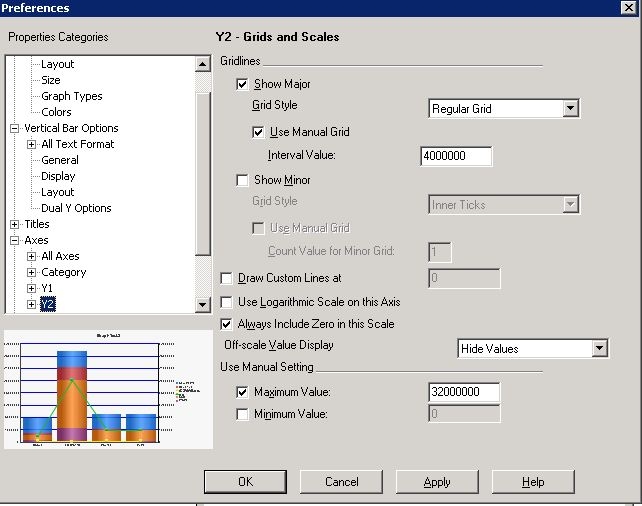
Change the graph to have dual axis and specify the second line to appear in Y2 axis. Set the min, max, and interval to match with Y1 and hide the label to make the graph look like single axis.