SYMPTOM:
When using the Pareto percentage chart and only one metric is used the percent to total line will not appear for certain attributes.
STEPS TO REPRODUCE:
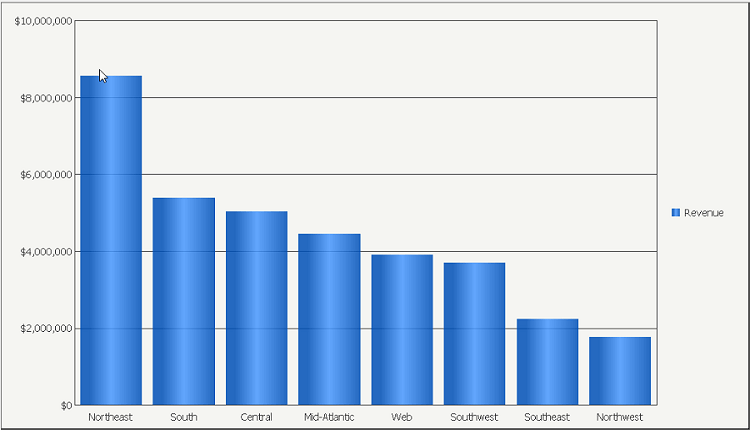
1. Create a report and add the region attribute to the rows and the revenue metric to the columns
2. Create a Pareto percentage chart (note: bar chart appears but line chart for percent to total does note)
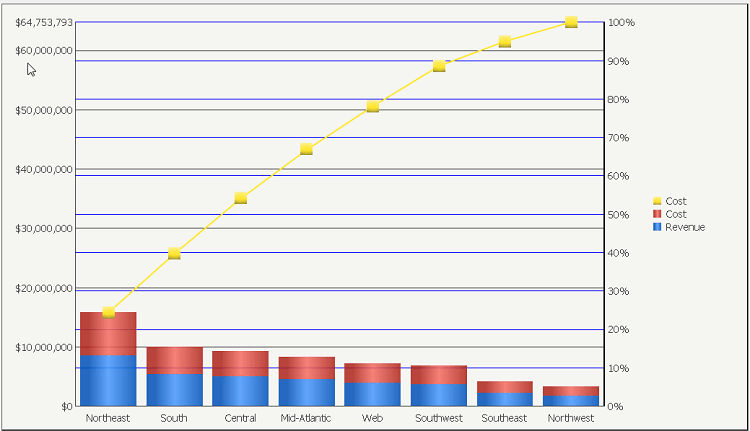
If another metric is added the percent to total line will appear, no matter what metric.
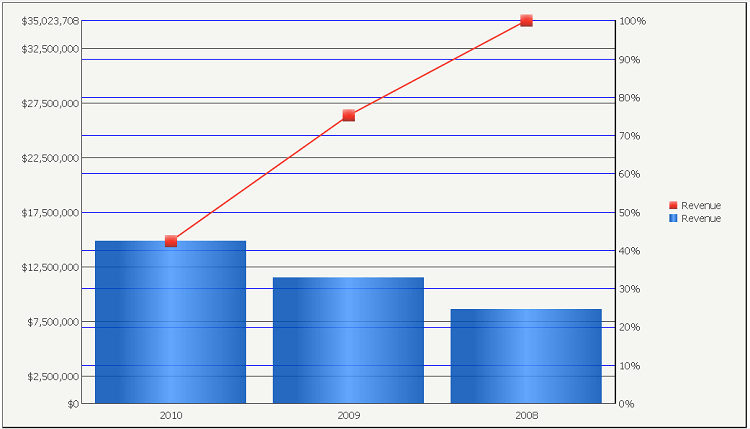
Also, if the year attribute is used instead of the region attribute the percent to total line will appear for one metric.
WORKAROUND:
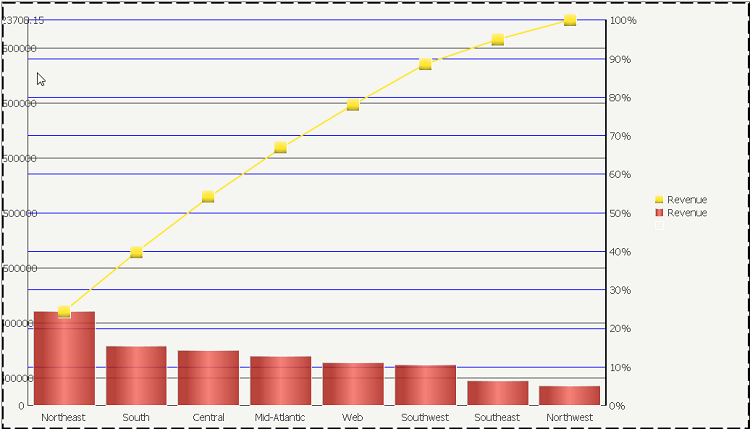
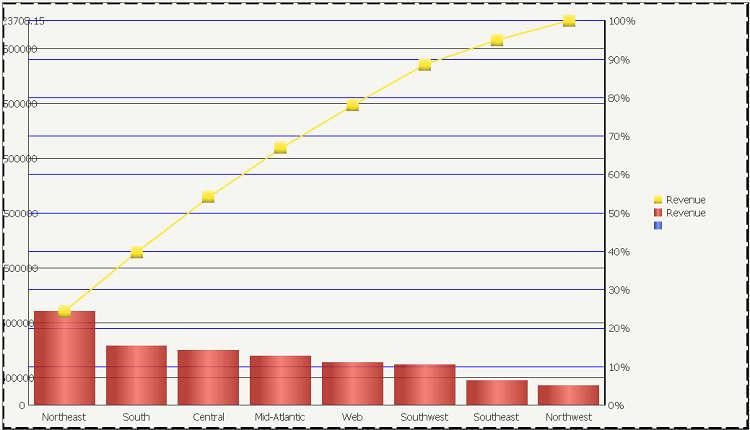
The following explains a workaround for creating a Pareto percentage chart with only one metric that will show the percent to total line and show the legend.
1. Create a derived metric with formula (Revenue – Revenue) and add to columns
2. In report data options change aliasing for new metric to blank
Hiding the new metric color on the legend cannot just be done by changing the color because of the default gradient applied to the graph colors.
1. Take a screenshot of the graph background
2. Format the legend marker to use Picture as its background type and select the new screenshot as the picture to be used