SYMPTOM:
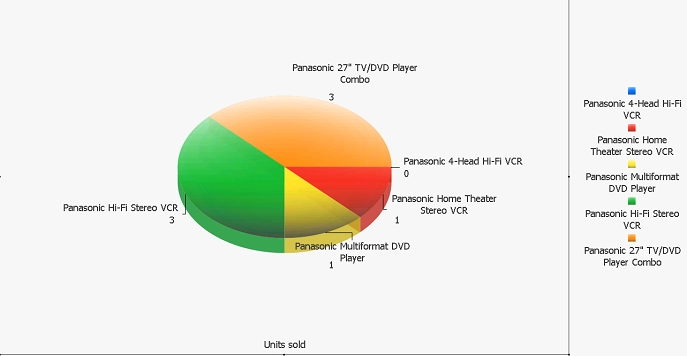
When using the graph options Use ‘Smart’ Label Placement on Pie Graph, the series returning “0” are not displayed.
STEPS TO REPRODUCE:
Follow the steps below to reproduce this issue using the Strategy Tutorial Project:
1) Create a new metric using the expression - 5] where is a fact.
2) Create a new report adding the Item attribute to rows and the newly created metric to columns.
3) Add the first local filter of type Attribute Qualification, Qualify on Elements and the In list operator based on the Item attribute, so select the elements Panasonic 4-Head Hi-fi VCR, Panasonic Home Theater Stereo VCR, Panasonic Multiformat DVD Player, Panasonic HI-FI Stereo VCR and Panasonic 27" TV/DVD Player Combo.
4) Add the second local filter of type Attribute Qualification, Qualify on Elements and the In list operator based on the Year attribute, so select the element 2008.
5) Add the third local filter of type Attribute Qualification, Qualify on Elements and the In list operator based on the Call Center attribute, so select the element Atlanta. The report local filter area should be similar to the example below:

6) Run the report in grid mode to obtain the result below:
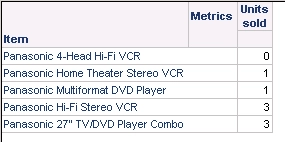
7) Switch to graph view mode and select the Pie Graph type.
8) Go to menu Graph and select Graph Options, under the Properties Categories, click on Series and check the options:
a. Use 'Smart' Label Placement
b. Show Values > Values outside Slices
c. Show Labels > Labels outside Slices
d. Show Leader Lines
The Pie Graph Series configuration should be equal to the example that follows:

9) Notice that the 0 metric value for Panasonic 4-Head Hi-fi VCR does not appear on the graph.

10) Disable the Use 'Smart' Label Placement to see Panasonic 4-Head Hi-fi VCR on the graph.
CAUSE:
This is a known issue in Strategy 9.x.
ACTION:
Please contact the Strategy Technical Support for an update on this issue.
