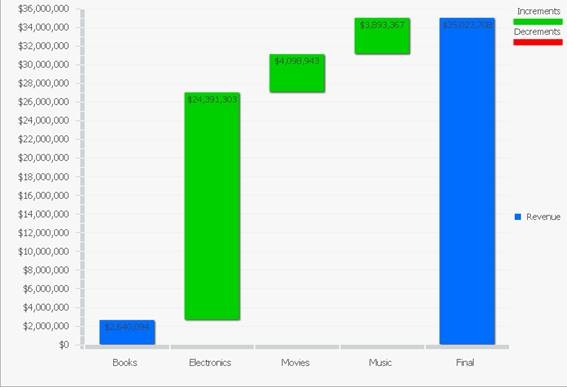
By default the Waterfall Widget does not show the label values over the series as shown:
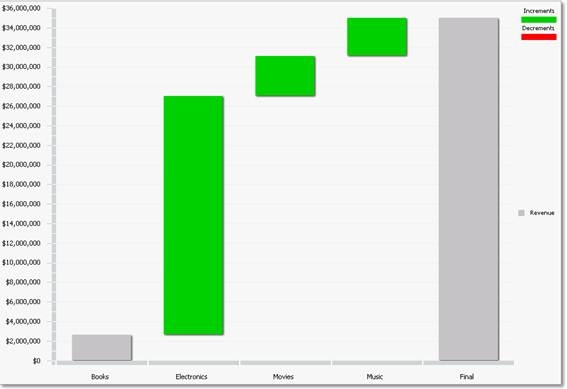
Follow the steps below in order to enable the label values through either Strategy Web or Developer:
First on Web:
1. Go to the editable mode.
2. Change the dataset view mode to Graph view.
3. Right click over the Waterfall Widget and click on Properties.
4. Select Format.
5. Select Series Values and All Data Values.
6. Check the option Show then OK.
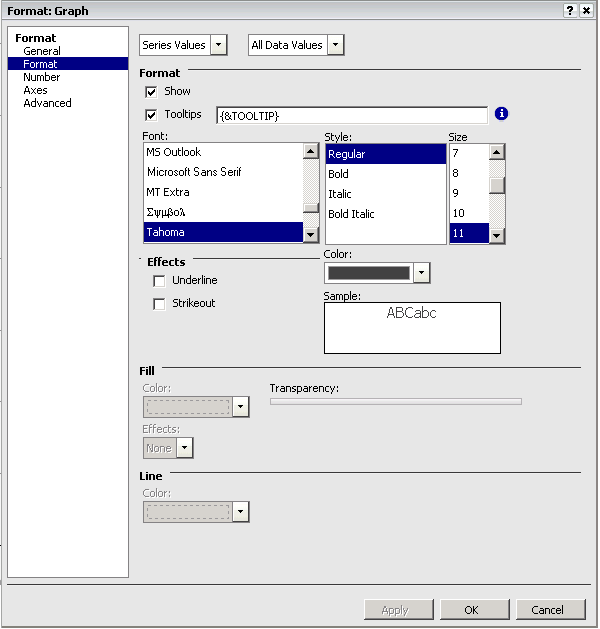
7. Go to the Flash View Mode.
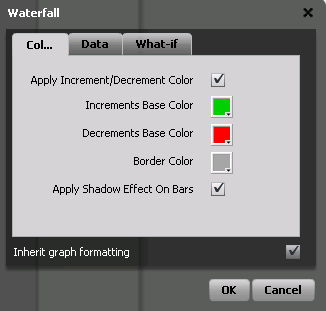
8. Right click over the Waterfall Widget and click on Properties.
9. Check the option Inherit graph formatting then OK:
Second in Developer:
1. Edit the Document.
2. Double click over the graph in order to select it.
3. Right click over the graph and select Graph Options.
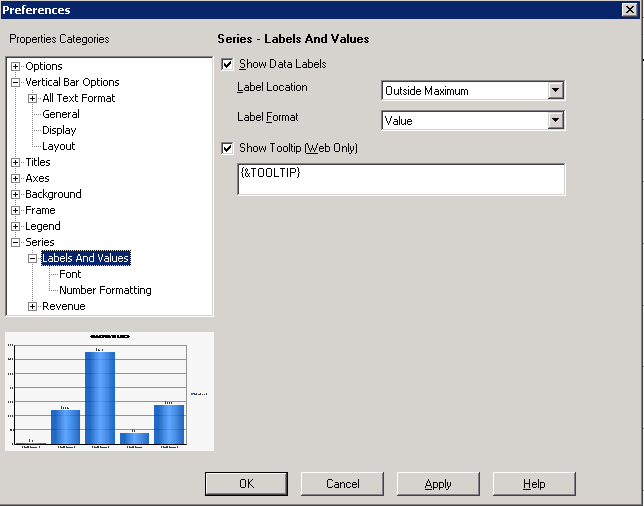
4. Expand Series and click on Labels and Values.
5. Check the option Show Data Labels then OK:
6. Run the document on Web in Flash View mode.
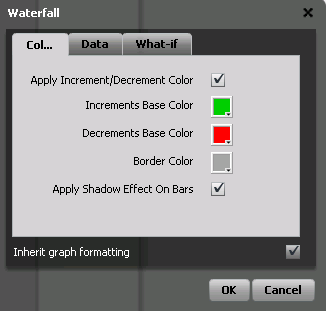
7. Right click over the Waterfall Widget and click on Properties.
8. Check the option Inherit graph formatting.
Now the Waterfall widget will display the label values over the series as shown: