EducationSoftwareStrategy.com
StrategyCommunity

Knowledge Base

Product

Community

Knowledge Base

TopicsBrowse ArticlesDeveloper Zone

Product

Download SoftwareProduct DocumentationSecurity Hub

Education

Tutorial VideosSolution GalleryEducation courses

Community

GuidelinesGrandmastersEvents
x_social-icon_white.svglinkedin_social-icon_white.svg
Strategy logoCommunity

© Strategy Inc. All Rights Reserved.

LegalTerms of UsePrivacy Policy
  1. Home
  2. Topics

KB40775: How to design a bar graph report with the color of children bar graph inherited from the color of the source bar being drilled in MicroStrategy Developer 9.x


Stefan Zepeda

Salesforce Solutions Architect • Strategy


How to design a bar graph report with the color of children bar graph inherited from the color of the source bar being drilled in MicroStrategy Developer 9.x

In some business scenario, it is required to design a stacked bar graph report with different color of each bar. When drill on a specific bar, the color needs to be inherited in the children bar graph and display as a single color.
 
The following steps demonstrates how to design this kind of report in Strategy Tutorial project:
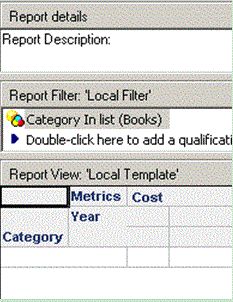
  • Create a report with Category attribute in rows , Year attribute and Cost metric in columns and a filter 'Category In List(Books)', as shown below:
     
ka02R000000kcZJQAY_0EM440000002D9S.gif
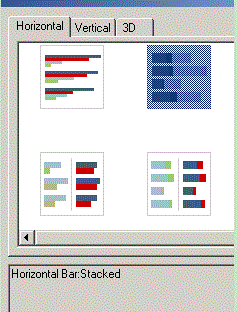
  • Run the report in horizontal stacked bar graph mode, as shown below:
     
ka02R000000kcZJQAY_0EM440000002D9W.gif
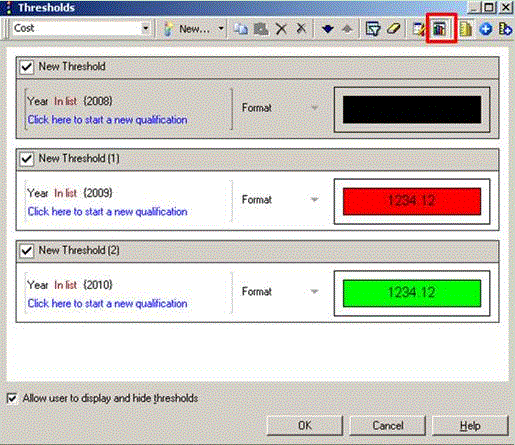
  • Follow the technical note below to set thresholds on Year attribute for 3 year elements:
     
    KB10675 (KB5700-752-1266): How to customize a color for an attribute value in graphs for MicroStrategy Desktop
     
    Enable "threshold on graph" for 3 thresholds, as shown below:
     
     
ka02R000000kcZJQAY_0EM440000002D9U.gif
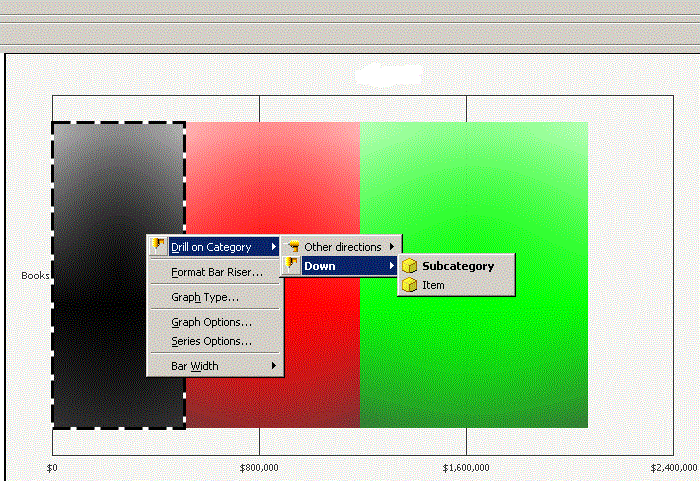
  • In parent graph, drill down to subcategory on year 2008 cost with black color, as shown below:
     
     
ka02R000000kcZJQAY_0EM440000002D9k.gif
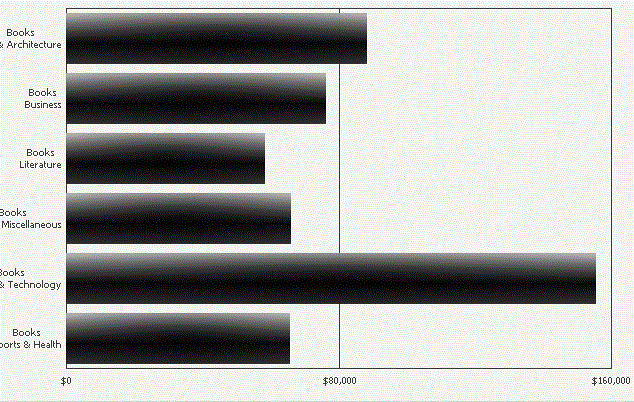
  • In children graph, all the costs of subcategory display black, as shown below:
     
     
ka02R000000kcZJQAY_0EM440000002D9f.gif
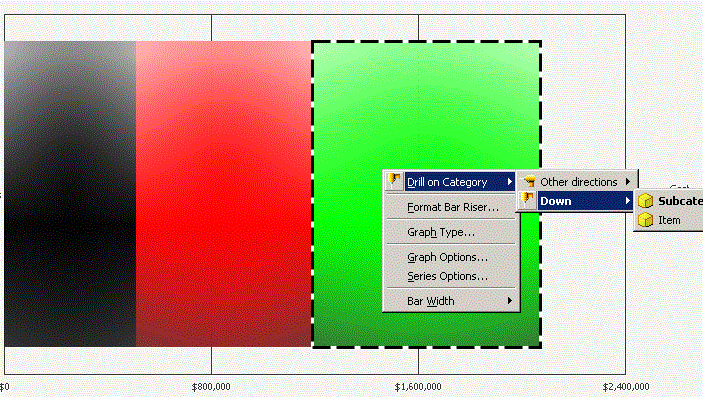
  • In parent graph, drill down to subcategory on year 2010 with green color, as shown below:
     
     
ka02R000000kcZJQAY_0EM440000002D9i.gif
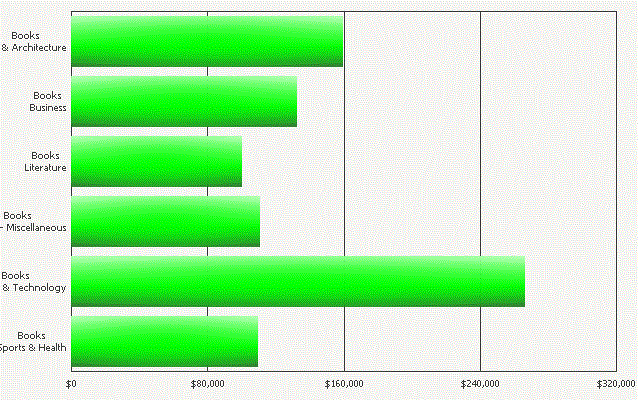
  • In children graph, all the costs of subcategory display green, as shown below:
     
     
ka02R000000kcZJQAY_0EM440000002D9Y.gif

 
Note:
 
If the threshold is not defined, children graph could not inherit color of source bar.


Comment

0 comments

Details

Knowledge Article

Published:

April 12, 2017

Last Updated:

April 12, 2017