EducationSoftwareStrategy.com
StrategyCommunity

Knowledge Base

Product

Community

Knowledge Base

TopicsBrowse ArticlesDeveloper Zone

Product

Download SoftwareProduct DocumentationSecurity Hub

Education

Tutorial VideosSolution GalleryEducation courses

Community

GuidelinesGrandmastersEvents
x_social-icon_white.svglinkedin_social-icon_white.svg
Strategy logoCommunity

© Strategy Inc. All Rights Reserved.

LegalTerms of UsePrivacy Policy
  1. Home
  2. Topics

KB40838: After changing the location of graph titles or legends for a document in MicroStrategy Developer 9x and 10.x the locations will default back to automatic layout mode preference locations when the document is run


Stefan Zepeda

Salesforce Solutions Architect • Strategy


KB40838: After changing the location of graph titles or legends for a document in MicroStrategy Developer 9x and 10.x the locations will default back to automatic layout mode preference locations when the document is run

SYMPTOM:
After inserting a graph in a Document in Strategy Developer 9x and 10.x and changing the position of the titles or legend, the changes made will not be visible when running the Document in PDF or Flash mode.  The locations will default back to what appears to be the locations for automatic layout mode.
 
STEPS TO REPRODUCE:

  • Create a new document and add a dataset in Strategy Developer
  • Insert a Vertical Area graph and add appropriate attributes and metrics
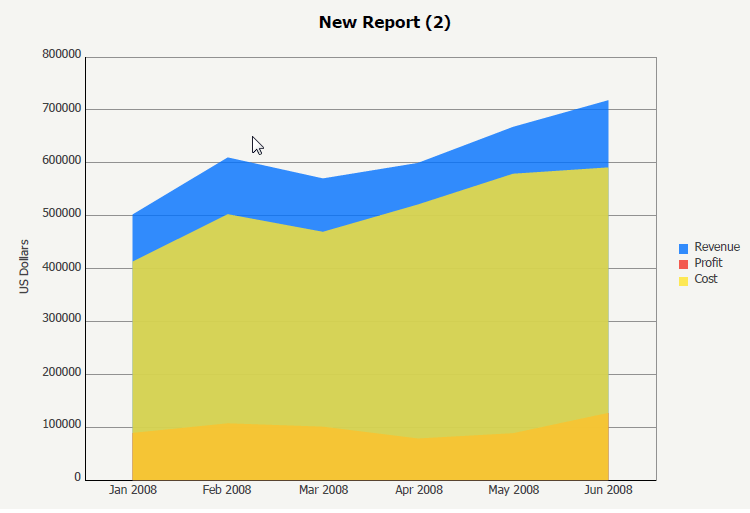
  • Double click the graph, then move the title or legend to the desired location
ka02R000000kZKLQA2_0EM440000002DB3.png
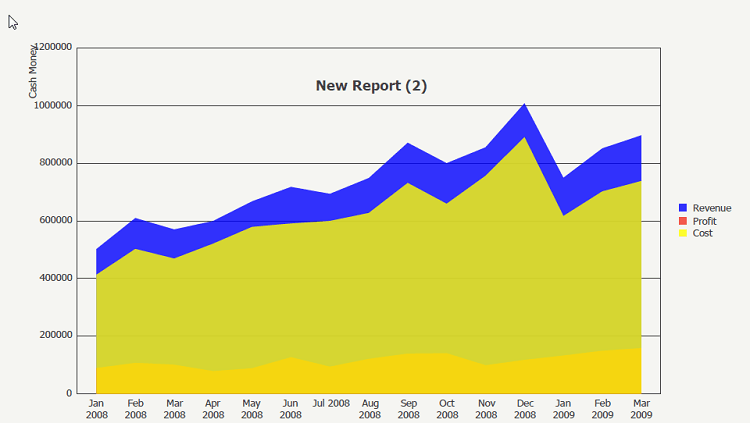
  • View the document in PDF view and notice the locations of the title do not reflect the changes previously made
ka02R000000kZKLQA2_0EM440000002DAp.png

CAUSE:
This is a known issue in Strategy Desktop 9.2.1
 
WORKAROUND:
  • Create a new report with the appropriate attributes and metrics needed for the graph
  • Move the title or legend to the desired location
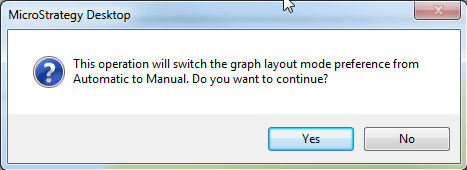
  • The following window will appear, click yes
ka02R000000kZKLQA2_0EM440000002DB1.png
  • Save the report as a graph
  • Create a document and add the graph to the report as a dataset
  • Drag the graph from the dataset window onto the document
  • Run the document and the changes made will be reflected.
ka02R000000kZKLQA2_0EM440000002DAs.png

Additional changes to the graph will also be reflected to the graph when the document is run.


Comment

0 comments

Details

Knowledge Article

Published:

June 20, 2017

Last Updated:

June 20, 2017