SYMPTOM:
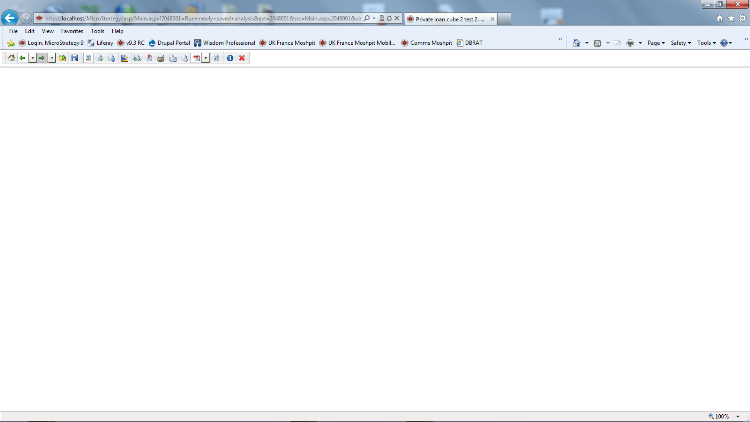
After creating a Visual Insight analysis, performing some manipulations, and then saving the analysis, it does not render correctly. A blank screen is displayed:
STEPS TO REPRODUCE:
1) Import an Excel spreadsheet. In this case we are using one called "Private Loans."xls (containing 5 attributes and 3 metrics):

2) Do not change any of the column attribute or metric assignments
3) Publish the cube
4) Create a grid report with all attributes and metrics then save and close
5) Right mouse click the report and select "Create Analysis"
6) Select the Vertical Line graph (left hand line graph vis widget)
7) The line graph should have a "Issue Date" on the category and "Amount Requested", "Amount Funded" as metrics.

8) The first date for Amount Requested in red is $3.5M, which is too large so other small values will not be visible.
9) Slide the "Issue Date" to the right to remove the first few days.
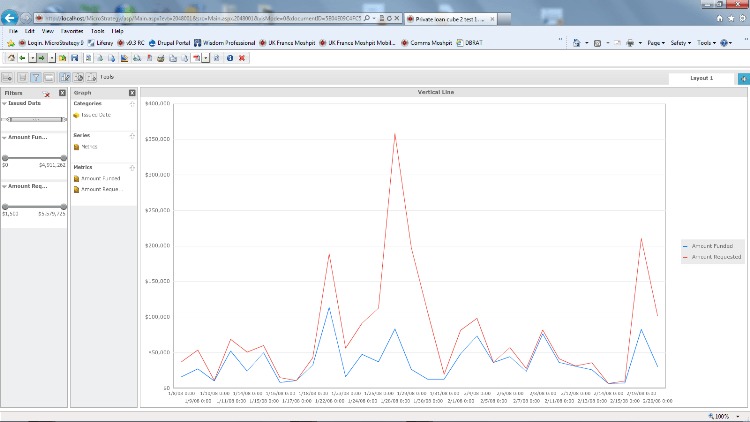
10) The graph will redraw and the other values will now be visible in more detail.
11) Save the Visual Insight analysis with a new name (do not overwrite).
12) Run the new Visual Insight analysis and it will not render, nothing is displayed.

CAUSE:
This issue occurred in Strategy 9.3.0 and was addressed in Strategy 9.3.1 and later.
ACTION:
Please contact Strategy Technical Support for an update on this issue.
