EducationSoftwareStrategy.com
StrategyCommunity

Knowledge Base

Product

Community

Knowledge Base

TopicsBrowse ArticlesDeveloper Zone

Product

Download SoftwareProduct DocumentationSecurity Hub

Education

Tutorial VideosSolution GalleryEducation courses

Community

GuidelinesGrandmastersEvents
x_social-icon_white.svglinkedin_social-icon_white.svg
Strategy logoCommunity

© Strategy Inc. All Rights Reserved.

LegalTerms of UsePrivacy Policy
  1. Home
  2. Topics

KB41242: How to design percent to total metric in a grid dynamically calculate values at parent time levels in MicroStrategy 9.x Developer


Stefan Zepeda

Salesforce Solutions Architect • Strategy


How to design percent to total metric in a grid dynamically calculate values at parent time levels in MicroStrategy 9.x Developer

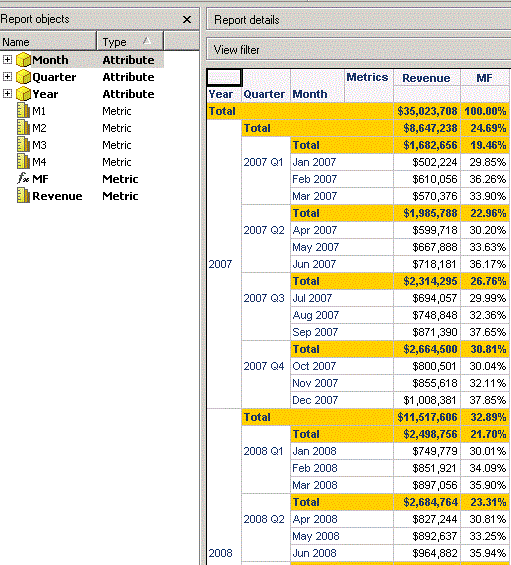
In some business scenario, it is required to design a report with percent to total metric which can dynamically calculate percent values at parent time levels, as shown below:
 

ka02R000000kbmRQAQ_0EM440000002D6n.gif

 
Metric MF calculates percent values for Metric Revenue in time hierarchy:  

  • MF of "Jan 2007" = Revenue of "Jan 2007" / total Revenue of "2007 Q1";
  • MF of "2007 Q1" = Revenue of "2007 Q1" / total Revenue of "2007";
  • MF of "2007" = Revenue of "2007" / total Revenue of all years;
  • MF of total Revenue of all years = total Revenue of all years / total Revenue of all years.

 
The following steps demonstrates how to design this kind of report in Strategy Tutorial project:
M1=Count(Month) {~};
M2= Sum(Revenue) {Quarter};
M3= Sum(Revenue) {Year};
M4= Sum(Revenue) { };
M1 can detect different time levels with different values. M1=12, 3 and 1 for Year, Quarter and Month, respectively. 

  1. Create four level metrics as shown below:
  2. Create a report with Year, Quarter and Month in rows and Revenue in columns.
  3. Insert a derived metric "MF" with case function as shown below:

Mf= Case(( = 1), (Revenue / ), ( = 3), ( / ), ( = 12), ( / ), ( / ))
 

ka02R000000kbmRQAQ_0EM440000002D6g.gif


ka02R000000kbmRQAQ_0EM440000002D6o.gif


Metric MF can calculate percent revenue values for each row at its parent time level.
For example:


  • Run the report as shown below:
    • Percent value for Jan 2007 is 502,224 / 1,682,656=29.85%;
    • Percent value for 2007Q1 is 1,682,656 / 8,647,238=19.46%;
    • Percent value for 2007 is 8,647,238 / 35,023,708=24.69%;
    • Percent value for total revenue of all years is 35,023,708 / 35,023,708=100.00%.

Comment

0 comments

Details

Knowledge Article

Published:

June 8, 2017

Last Updated:

June 8, 2017