EducationSoftwareStrategy.com
StrategyCommunity

Knowledge Base

Product

Community

Knowledge Base

TopicsBrowse ArticlesDeveloper Zone

Product

Download SoftwareProduct DocumentationSecurity Hub

Education

Tutorial VideosSolution GalleryEducation courses

Community

GuidelinesGrandmastersEvents
x_social-icon_white.svglinkedin_social-icon_white.svg
Strategy logoCommunity

© Strategy Inc. All Rights Reserved.

LegalTerms of UsePrivacy Policy
  1. Home
  2. Topics

KB41251: How to add more than one custom lines with constant values into a graph in MicroStrategy Developer 9.x


Stefan Zepeda

Salesforce Solutions Architect • Strategy


How to add more than one custom lines with constant values into a graph in MicroStrategy Developer 9.x

 
In some business scenarios, it is required to add two or more than two custom lines into a graph. However, in Graph Preferences -> Axes -> Y, only one custom line is allowed by design, as shown below:

ka02R000000kbyEQAQ_0EM440000002D6s.jpeg

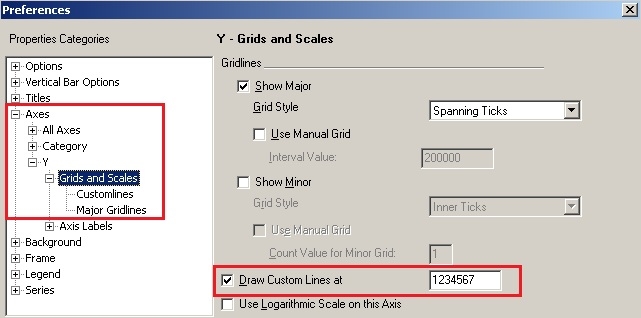
NOTE: Max value of Custom Line is 9,999,999 - it only supports value within 7 digits.
 
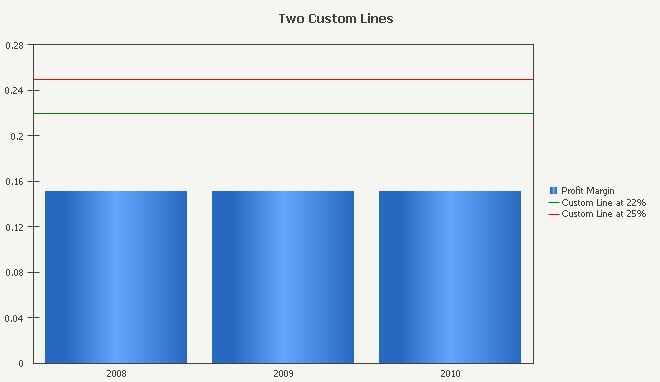
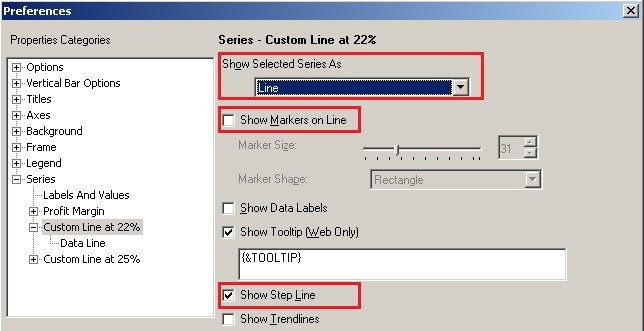
The following precedure offers a workaround to add more than one custom lines into a graph using Strategy Tutorial. In the workaround, Vertical Bar graph type and  two expected custom lines with constant values of 22% and 25% are used as the example.

  • Create a report with an attribute in row and a metric in column.
  • Menu -> Insert -> New Metric. Using Min() function to create a metric with constant value 0.22, as shown below:
ka02R000000kbyEQAQ_0EM440000002D6t.jpeg
  • Sample Code/Error
    Min(0.22){}

     
  • Run the report in Graph View and select Graph type as Vertical Bar.
  • Menu -> Graph -> Preferences -> Series, do the changes as shown below:
    • Change 'Show Selected Series As' option from 'Default for Chart Type' to 'Line'
    • Uncheck 'Show Markers on Line'
    • Check 'Show Step Line'
ka02R000000kbyEQAQ_0EM440000002D6l.jpeg
  • Do the same changes to another metric.
    NOTE: Line color can be modified under Series -> -> Data Line, as shown below:
ka02R000000kbyEQAQ_0EM440000002D70.jpeg
  • Click on OK to save the change to the graph.

 
NOTE: The final graph displays as expected with two constant value custom lines, as shown below:

ka02R000000kbyEQAQ_0EM440000002D6r.jpeg


Comment

0 comments

Details

Knowledge Article

Published:

June 5, 2017

Last Updated:

June 5, 2017