EducationSoftwareStrategy.com
StrategyCommunity

Knowledge Base

Product

Community

Knowledge Base

TopicsBrowse ArticlesDeveloper Zone

Product

Download SoftwareProduct DocumentationSecurity Hub

Education

Tutorial VideosSolution GalleryEducation courses

Community

GuidelinesGrandmastersEvents
x_social-icon_white.svglinkedin_social-icon_white.svg
Strategy logoCommunity

© Strategy Inc. All Rights Reserved.

LegalTerms of UsePrivacy Policy
  1. Home
  2. Topics

KB41318: How to modify graph tooltip display for Report Services documents in MicroStrategy Web 9.2.1 and above


Community Admin

• Strategy


How to modify graph tooltip display for Report Services documents in MicroStrategy Web 9.2.1 and above

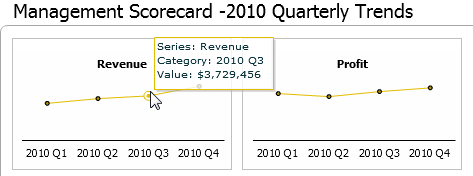
Tooltips can be enabled to display when hovering over series elements in Report Services graphs in Strategy Web 9.2.1, as shown below:


ka04W000000OfbaQAC_0EM4400000026zi.png

 
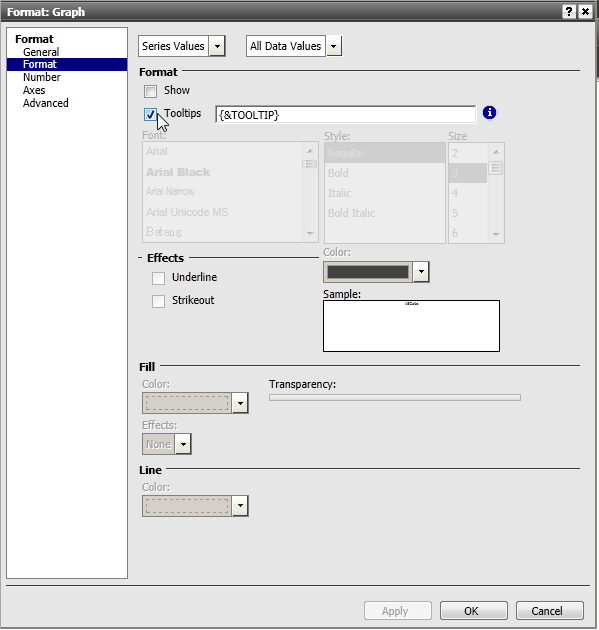
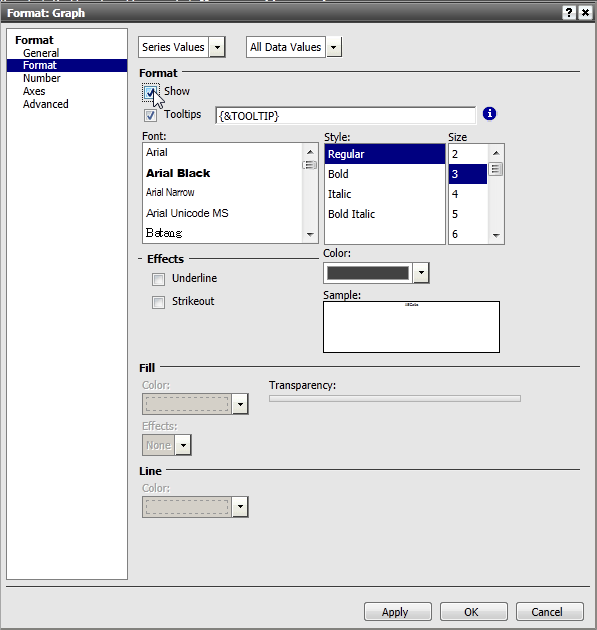
To toggle the tooltip display, follow the steps below:

  • Within Strategy Web 9.2.1, edit the document in Editable Mode.
  • Right-click the graph report and choose the Format Graph option.
  • Click on the Format tab and choose Series Values in the drop down menu.
  • Check or uncheck the Tooltips box to toggle the tooltip display, as shown below. With version 9.0.0 or newer, the formatting specified on the grid is passed on to the values in the tooltip by default.
     
ka04W000000OfbaQAC_0EM4400000026zb.png

 
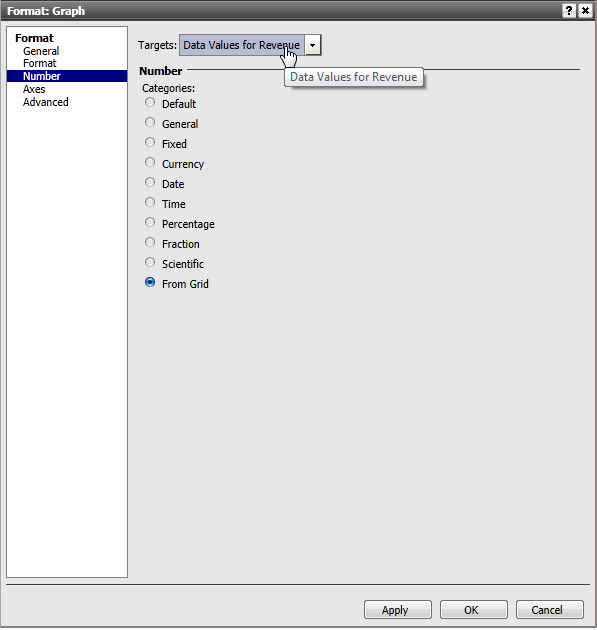
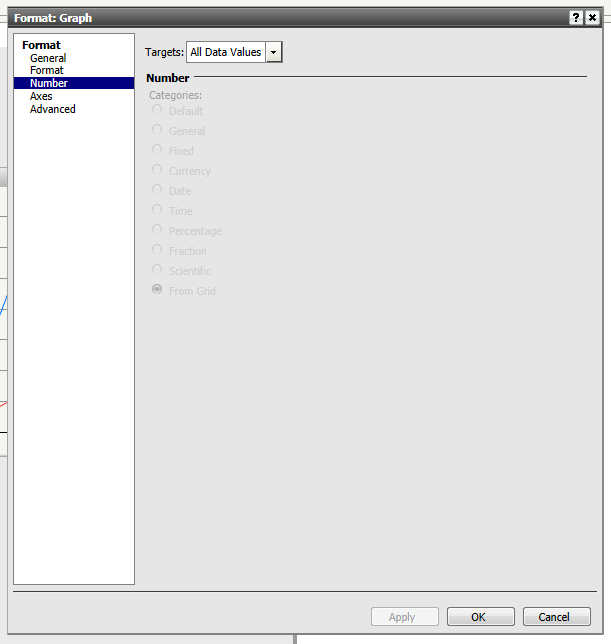
To modify the number formatting displayed for the tooltip value, follow the steps below:

  • Within Strategy Web 9.x, edit the document.
  • In Editable Mode, right-click the graph report and choose the Format Graph option.
  • Click on the Numbers tab and select the desired target number formatting, as shown below:

ka04W000000OfbaQAC_0EM4400000026zk.png
  • NOTE: If the numbers tab is grayed out and inactive, as shown below, return to the Format tab.
ka04W000000OfbaQAC_0EM4400000026zf.png
  • From the Format tab, click on Series Values from the first drop-down menu and enable the Show box under Format, as shown below.
  • Return to the Numbers tab and the options should be activated.
  • To remove the data values from the graph, return back to the Format tab and deselect the Show button.
ka04W000000OfbaQAC_0EM4400000026zd.png

 
 Related Tech Notes:  KB18607: Graph’s tooltips do not keep the number format defined in the report in Strategy Web 9.x
 
KB43849


Comment

0 comments

Details

Knowledge Article

Published:

May 19, 2017

Last Updated:

June 1, 2018