EducationSoftwareStrategy.com
StrategyCommunity

Knowledge Base

Product

Community

Knowledge Base

TopicsBrowse ArticlesDeveloper Zone

Product

Download SoftwareProduct DocumentationSecurity Hub

Education

Tutorial VideosSolution GalleryEducation courses

Community

GuidelinesGrandmastersEvents
x_social-icon_white.svglinkedin_social-icon_white.svg
Strategy logoCommunity

© Strategy Inc. All Rights Reserved.

LegalTerms of UsePrivacy Policy
  1. Home
  2. Topics

KB414205: How to return the row-level subtotal of individual custom group/consolidation elements with other attributes on the report in MicroStrategy


Community Admin

• Strategy


A user may have a report with a custom group/consolidation and attributes and want to return the total within each custom group/consolidation element. Normally, users would accomplish this with an attribute by setting it to the level of that attribute, however that may not produce desirable values. Being able to run this calculation would be useful for returning the percent-to-total across individual custom group/consolidation elements.

A user may have a report with a custom group/consolidation and attributes and want to return the total within each custom group/consolidation element. Normally, users would accomplish this with an attribute by setting it to the level of that attribute, however that may not produce desirable values. Being able to run this calculation would be useful for returning the percent-to-total across individual custom group/consolidation elements.
 
Follow the steps below in Strategy Developer to accomplish this task:
  • Create a duplicate of the metric that is part of the total calculation.
  • Set the level of the metric to all attributes in the template that are not already part of the level and set the filtering and grouping to the newly added attribute levels to none/none.
  • Add the metric to the report.

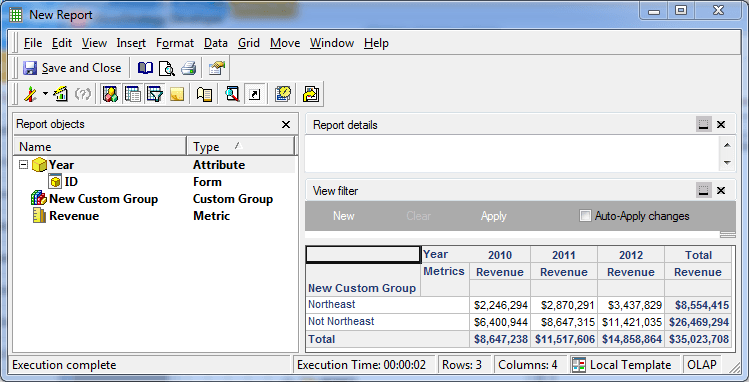
    For this particular report, a custom group will be placed in the rows with two elements: Region in list: Northeast and Region not in list: Northeast. For the custom group, "enable subtotal displays" is enabled. The Year attribute and the Revenue metric will be placed in the columns of the report.

ka04W000000uGCMQA2_0EM440000002CT5.png
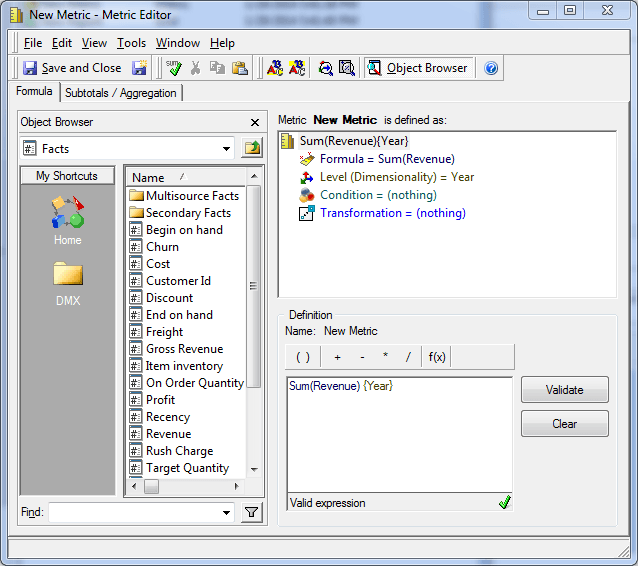
  • Next, a metric is created at the level of Year with filtering and grouping set to none/none.

ka04W000000uGCMQA2_0EM440000002CT6.png
  • Adding this to the report should yield the following:

ka04W000000uGCMQA2_0EM440000002CTM.png
  • The values for New Metric display the row-level subtotal which can be used for percent-to-total calculations over the rows.

 
Note: The placement of attributes in the report do not matter, so long as the level of the metric is set appropriately. If an attribute that is directly related to the custom group/consolidation attribute is placed in the columns, cross-tab nulls will appear, which is by design.
 
KB414205


Comment

0 comments

Details

Knowledge Article

Published:

June 6, 2017

Last Updated:

January 1, 2019