EducationSoftwareStrategy.com
StrategyCommunity

Knowledge Base

Product

Community

Knowledge Base

TopicsBrowse ArticlesDeveloper Zone

Product

Download SoftwareProduct DocumentationSecurity Hub

Education

Tutorial VideosSolution GalleryEducation courses

Community

GuidelinesGrandmastersEvents
x_social-icon_white.svglinkedin_social-icon_white.svg
Strategy logoCommunity

© Strategy Inc. All Rights Reserved.

LegalTerms of UsePrivacy Policy
  1. Home
  2. Topics

KB41523: Font color changes to series values in a pie graph in a document are not shown in Flash mode in MicroStrategy Web


Community Admin

• Strategy


In Flash view mode all series values in the pie graph take the color of the first series value

SYMPTOM:
 
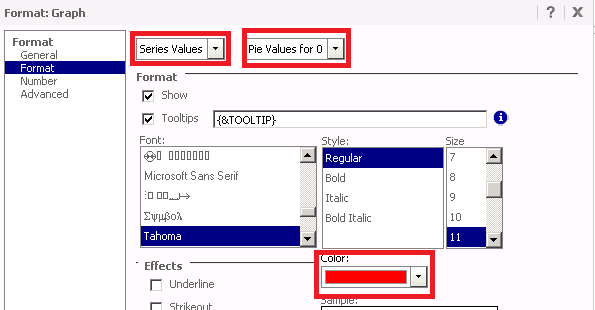
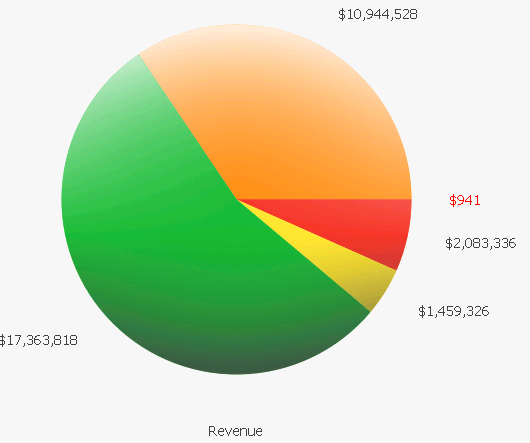
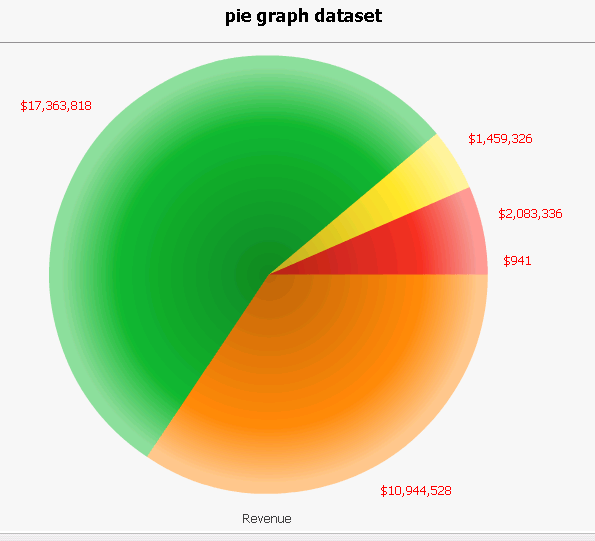
When a user changes the color of a series value in a pie graph in a document in Strategy Web 9.3.0, the color renders as expected in Interactive and Express modes. When viewed in Flash mode however, all series values in the graph take the color of the first series value.
 
STEPS TO REPRODUCE:
 
 Follow these steps in Strategy Tutorial 9.3.0 reproduce:

  • Create a report in Strategy Web with "Days to Ship" in the rows and "Revenue" in the columns.
  • Run the report and turn the grid into a pie graph with "Series by Row" by clicking on the buttons shown below:
     
ka04W000000OgFqQAK_0EM4400000026xQ.png
  •  
    Note: Save and close the report.
  • Create a blank dashboard, add the previously created graph as a dataset and drag the graph onto the dashboard.
  • Run the dashboard in editable mode.
  • Right click the graph,navigate to "Format Graph", and click "Format".
  • Choose "Series Values", and from the second dropdown menu, select the first available element. In the sample below, for Days to Ship, the first element is '0'.
    Select "Pie Values for 0", and change the series value color to red as shown below:
     
ka04W000000OgFqQAK_0EM4400000026xN.png
  • Run the dashboard in Interactive mode and notice that only the Series Value for 0 Days to Ship is Red as expected, as shown below:
     
ka04W000000OgFqQAK_0EM4400000026xb.png
  • Run the dashboard in Flash mode and notice that all Series Values are now Red, as shown below:
     
ka04W000000OgFqQAK_0EM4400000026xO.png

CAUSE:
 
This is a known issue in Strategy Web 9.3.0 where all Series Values take the color of the first value in pie graphs in Flash mode.
 
ACTION:
 
This issue has been addressed in Strategy 9.3.1. Upgrade to take advantage of this fix.
 
WORKAROUND:
 
Use Interactive mode.


Comment

0 comments

Details

Knowledge Article

Published:

June 16, 2017

Last Updated:

June 16, 2017