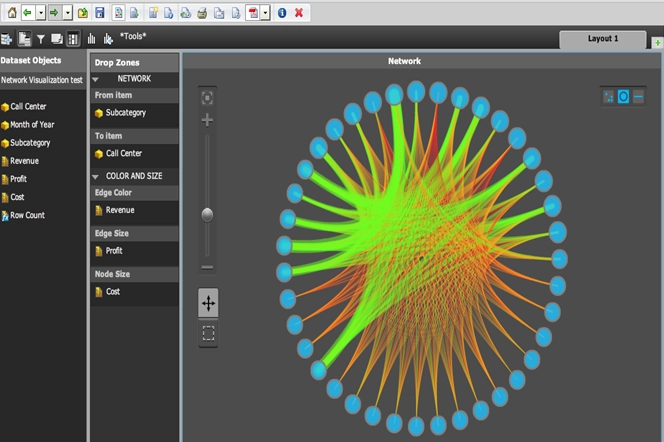
The Network Visualization Widget uses a technique more commonly known as node-link diagram, which is a set of nodes connected to each other by edges.
In a node link diagram, the nodes represent the elements of a set and the edges can be interpreted as a relationship between them. The Network Visualization Widget facilitates the visual representation of characteristics of the nodes and their relationships, such as the color and size of the nodes and the thickness and color of the edges.
For instance, the color of the nodes may be used to encode a metric value associated with each element, or simply to identify the categories the nodes belong to. The thickness and color of the edges can be used to encode metric values that describe the relationship between the nodes, for example the strength of the relationship or affinity.
Data Requirement:
The Network Visualization widget required two datasets
