Introduction:
Need to create a report with a metric that calculates the number of distinct customers. However, the metric must display in the area of subtotal, the total number of customers inserted into the data warehouse, not the sum of the values of this metric.
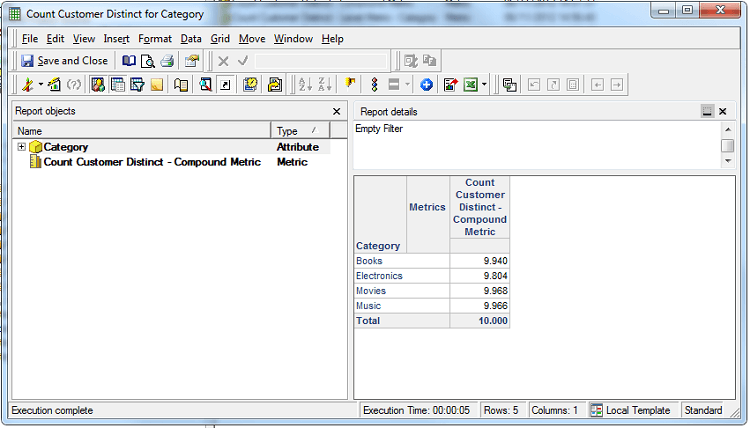
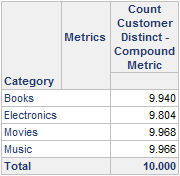
When the report is executed, the data is shown as below:
To get this data, perform the steps provided below:
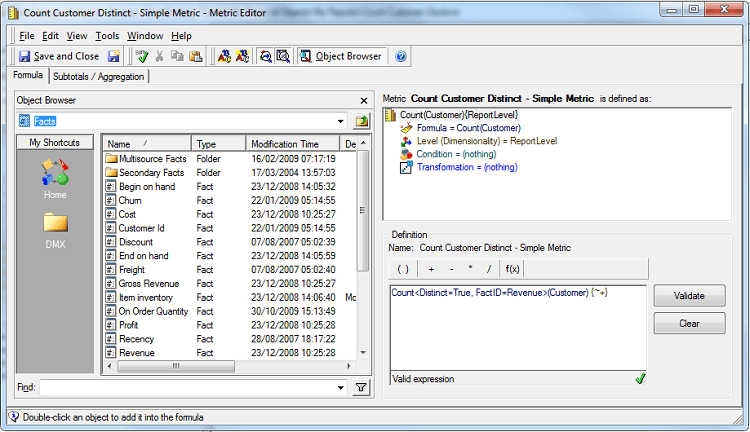
1. Create a metric with Count Function applied to the attribute Customer. Set the parameters for the function Count as Distinct=True and FactID=fact that permits to relate the attribute used in the definition of the metric and the attribute that will be part of the report. It was used the fact Revenue, because according to the data model design, customers generated revenues are those that effectively compare something that can be classified into product category (Category is the attribute to be used in the report).
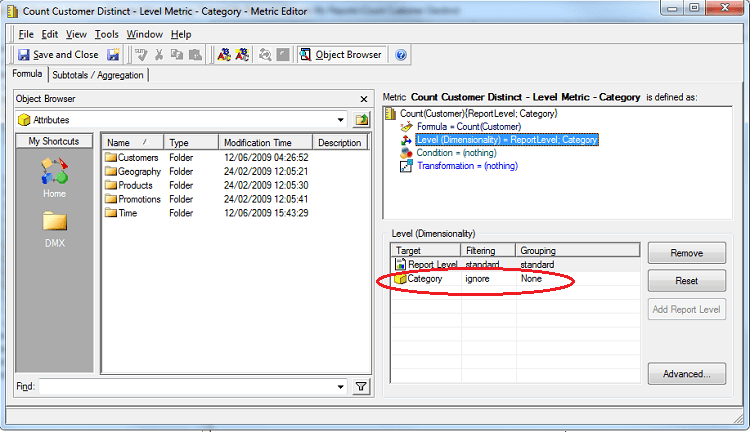
2. Create a new metric with the same definition of the metric above.
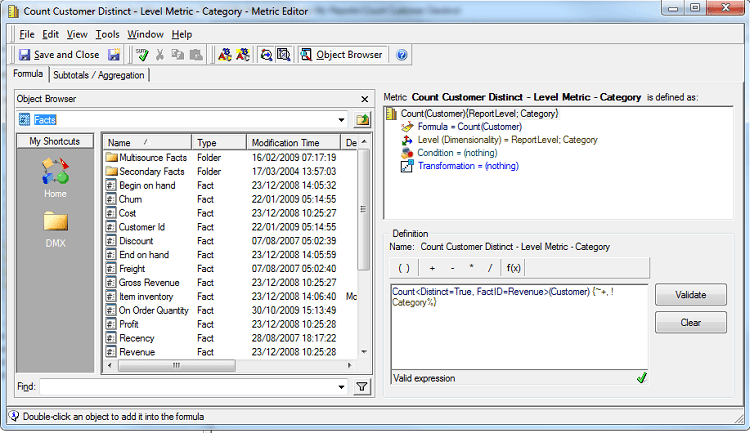
3. This new metric should have the Level (dimensionality) by Category attribute, as shown below.
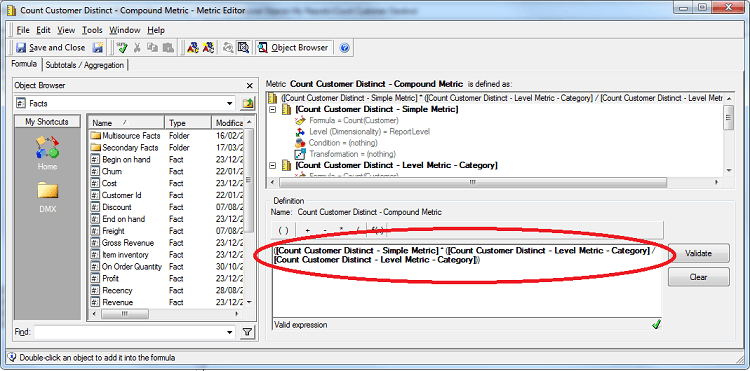
4. Then it creates a third metric, a compound metric. Note the picture with the definition.
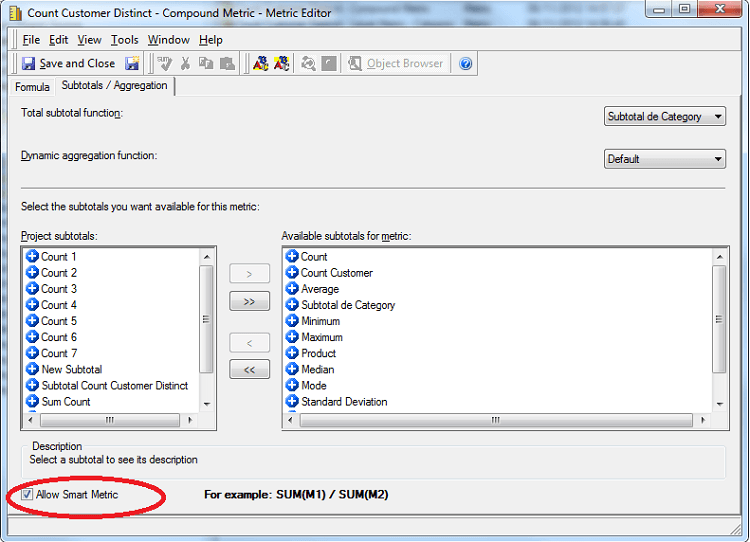
5. Another important observation is not to forget to enable "Smart Metric”.
6. Finally, just create the report with the attribute (Category) and the third metric. Do not forget to enable Subtotal (F11). Note the next figure.