This document provides an example of how to create a custom report filter that returns data for the first (or last) "X" number of days in a particular month. This is valuable if the customer wishes to have a report that only includes data for the first (or last) one or two weeks of a month. For example, a user might wish to measure and compare business performance between the first and second half of each month.
Example:
The below example illustrates how to create a report filter that only displays the last seven days of each month on a grid.
1. Create a new metric with the definition: Max(Day) {Day+} . Save and close as "M1".

2. Create a second metric with the definition: "Rank<ASC=False, BreakBy={Month}>()" Save and close as "M2"
Note: If a user would like to create a report filter that filters on the first 7 days of the month (as opposed to the last), one would need to set "ASC=TRUE" in the above statement.

3. Create a new filter within the report. Choose "Add a Set qualification."
Type: Metric
Output level= Day
Metric = M2
Function=Metric Value
Operator=Less than or equal to
Value=7
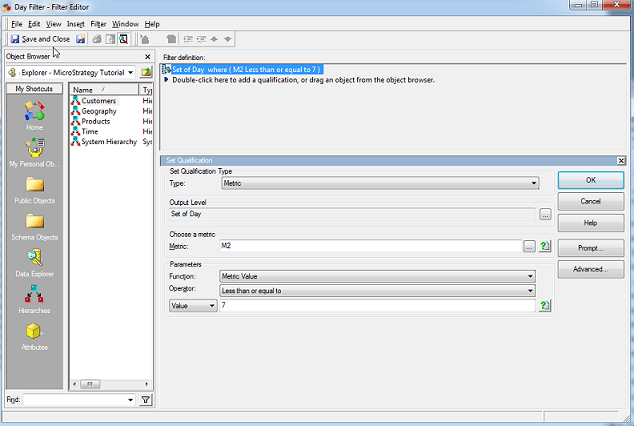
4. Click OK to add the filter to the report and execute.
