SYMPTOM:
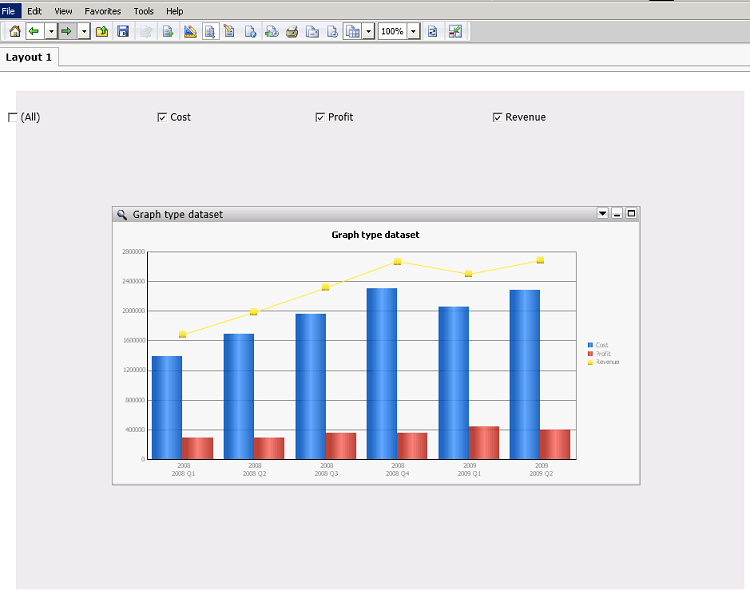
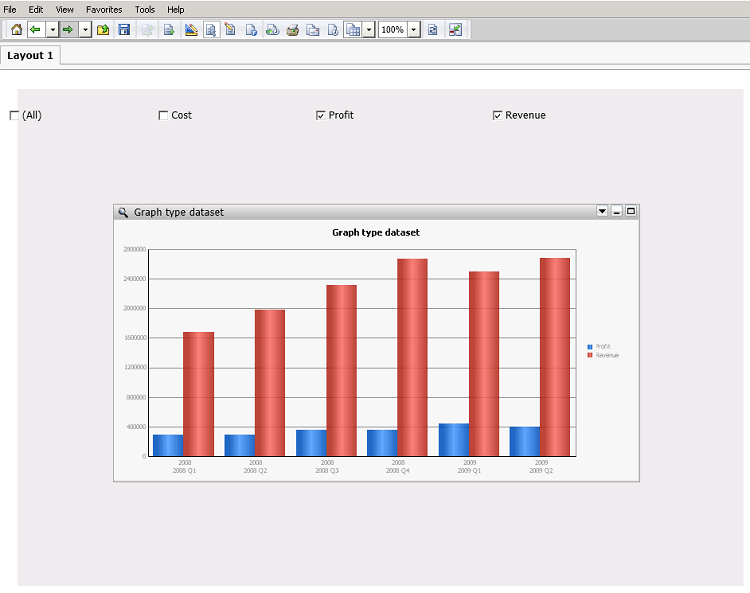
When a user creates a combination bar and line graph targeted by a metric selector, even if the metrics are assigned to display as a certain graph type, e.g. Bar vs. Line, they will display differently depending on what metrics are selected at the time. For example, even if the Revenue metric is assigned to display as a line graph, it will sometimes display as a bar chart depending on which other metrics are selected.
STEPS TO REPRODUCE
CAUSE:
This is working as designed. The issue described here is very similar to the one described in tech note KB37102, except this is with the metric series type while the issue in the other tech note is with the metric series color.
