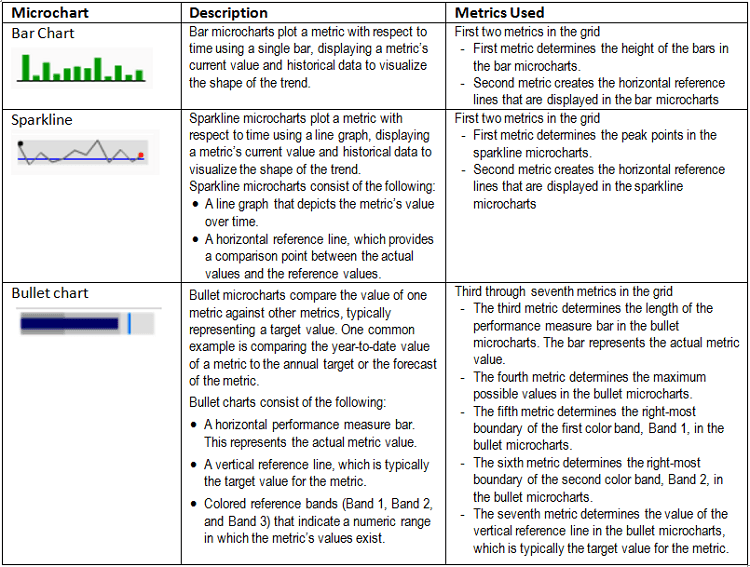
When using a Microchart, the location of the metrics in the grid will determine exactly what they are used for in each type of Microchart. See the chart below for an explanation on each type of Microchart and the metrics used.
Any additional metrics are displayed in the columns.
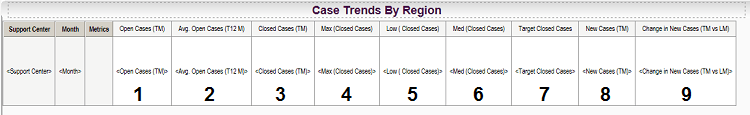
Example:
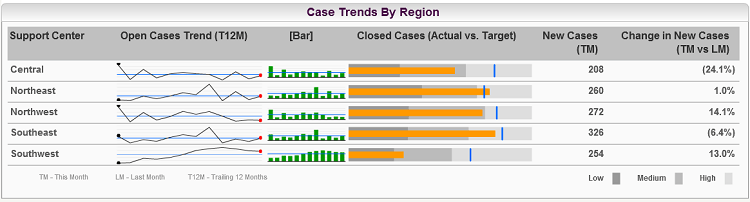
For the following grid using 9 metrics, the below Microchart will be displayed.
Sparkline:
Bar Chart:
Bullet:
The eighth and ninth metrics, New Cases and Change in New Cases, display just as columns.
Note:
Users cannot specify which metrics are used for each concept in the Microchart. An enhancement has been logged to decouple the metric association between sparkline and bar chart so that different metrics can be displayed in each.
Contact Strategy Technical Support for an update on the enhancement request.