EducationSoftwareStrategy.com
StrategyCommunity

Knowledge Base

Product

Community

Knowledge Base

TopicsBrowse ArticlesDeveloper Zone

Product

Download SoftwareProduct DocumentationSecurity Hub

Education

Tutorial VideosSolution GalleryEducation courses

Community

GuidelinesGrandmastersEvents
x_social-icon_white.svglinkedin_social-icon_white.svg
Strategy logoCommunity

© Strategy Inc. All Rights Reserved.

LegalTerms of UsePrivacy Policy
  1. Home
  2. Topics

KB42391: The Interactive Bubble Graph tooltip doesn’t show the correct metric value in MicroStrategy Web


Community Admin

• Strategy


The Interactive Bubble Graph tooltip doesn’t show the correct metric value in MicroStrategy Web 9.x and 10.x.

SYMPTOM:
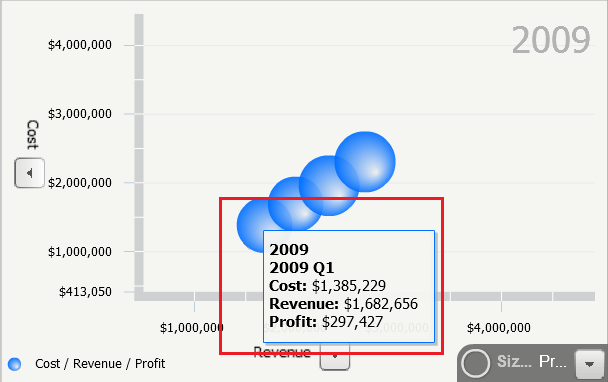
In Strategy Web 9.x, when an Interactive Bubble Graph is created with 3 attributes in the rows, the tooltip for the bubbles don’t show the correct metric values. Instead of aggregating the metrics at the level of the attribute represented in the bubble, it is calculating it at the lowest attribute level in the underlying dataset.
 
STEPS TO REPRODUCE:

  • Create a report with the “Year”, “Quarter” and “Month of Year” attributes in the rows and the “Cost”, “Revenue” and “Profit” metrics in the columns.
  • Execute the report.
  • Verify the value metrics. Observe the value of “Revenue”, “Cost”, and “Profit” ($502,224, $413,050, and $89,174, respectively) on the first row.
ka04W000000Og3VQAS_0EM4400000026qV.png
  • Create a dashboard and add the report above as dataset.
  • Convert the grid into an “Interactive Bubble Graph” widget.
  • Execute the dashboard in Flash Mode.
  • Right click on the widget and select “Properties”.
  • Click on the “Drilling” tab in the pop-up dialog and click the “Enable drilling” check box, like shown below.
ka04W000000Og3VQAS_0EM4400000026ql.png
  • The value for each of the metrics do not corresponds of the element “2009 Q1” in the Quarter attribute, but correspond to the “January” element in the Month attribute.
ka04W000000Og3VQAS_0EM4400000026qc.png

CAUSE:
This is working as designed, the Interactive Bubble Graph Widget considers the metric values on the first row for each Quarter elements as a Quarter subtotal.
 
ACTION:

  • Right click on the widget in design mode and select “Edit Totals”.
  • Go to the “Advanced” tab and enable subtotal for the lowest attribute, as shown below.
ka04W000000Og3VQAS_0EM4400000026qT.png
  • Go to “Display” tab and select “Top of each level” under “Subtotal positions by row”, like shown below.
ka04W000000Og3VQAS_0EM4400000026qe.png
  • Execute the dashboard in Flash Mode.
ka04W000000Og3VQAS_0EM4400000026qa.png
  • ff

For more information on a similar issue, refer to the following technical note:
KB35880: The first element of child attribute is missing after drilling down from an Interactive Bubble Graph widget in MicroStrategy Web 9.x


Comment

0 comments

Details

Knowledge Article

Published:

July 6, 2017

Last Updated:

July 6, 2017