SYMPTOM
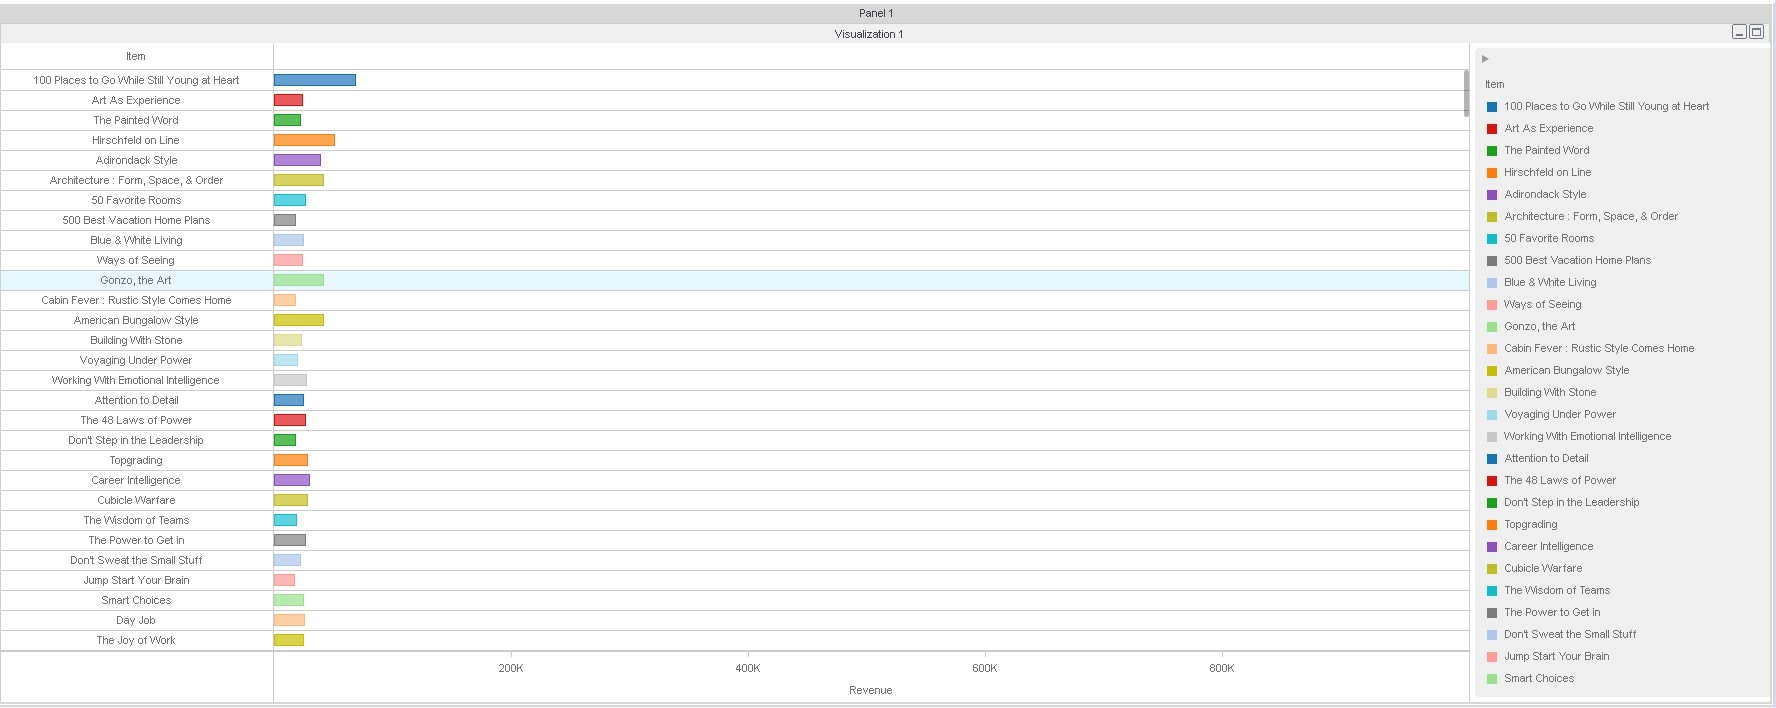
The Visual Insight Dashboard Graph Bar Labels no longer appears after conversion to Report Services Document in Strategy Web Universal Universal 10.3 running on Glassfish or Tomcat, as shown:
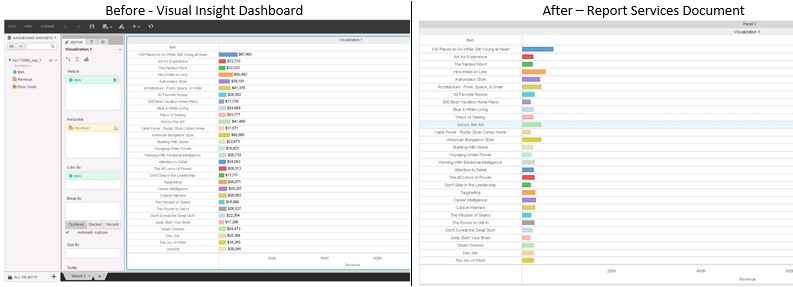
Observation: This issue was reproduced in Tomcat and Internet Information Services.
STEPS TO REPRODUCE
1) Create a report - Add: the Item attribute and the Revenue metric
2) Create a Visual Insight Dashboard based on the newly created report
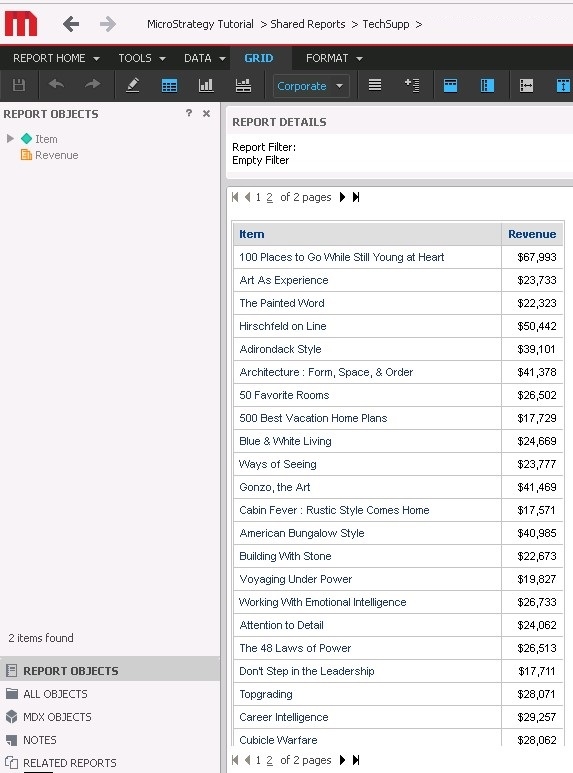
3) Select the Bar Graph visualization
4) Add Item into the Vertical area
5) Add Revenue into the Horizontal area
6) Color By Item
7) Into the Vertical area, right mouse click on Item and select Left Row
8) In the workable area, enable Labels, right mouse click over any bar and select Data Labels > Only Value
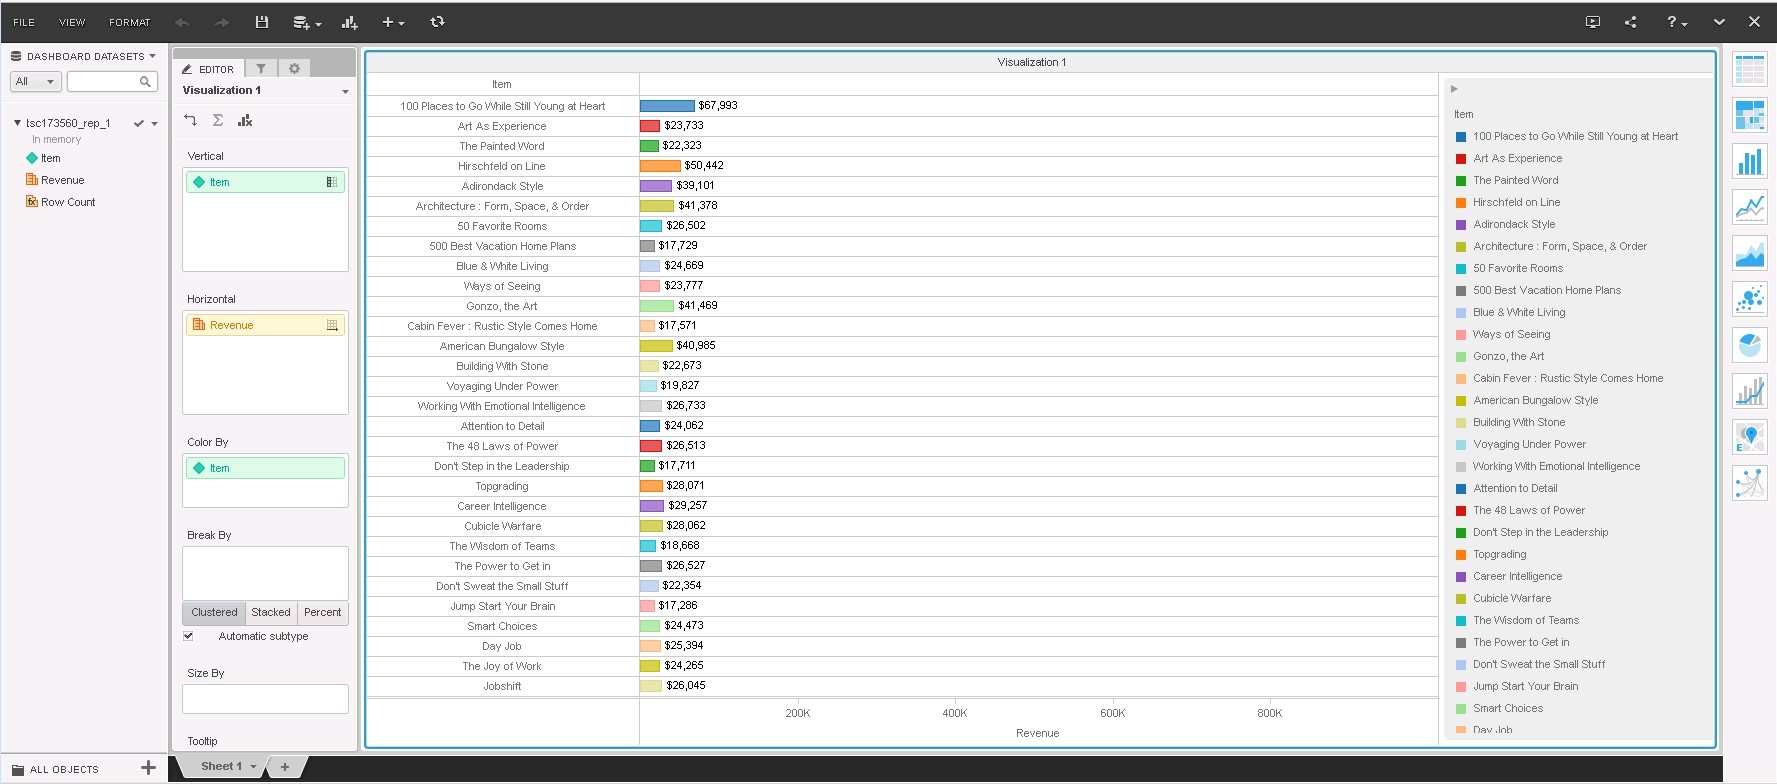
9) Save, close and convert into Report Services Document
10) Run the newly converted Report Services Document in presentation mode to confirm the data labels are not displayed
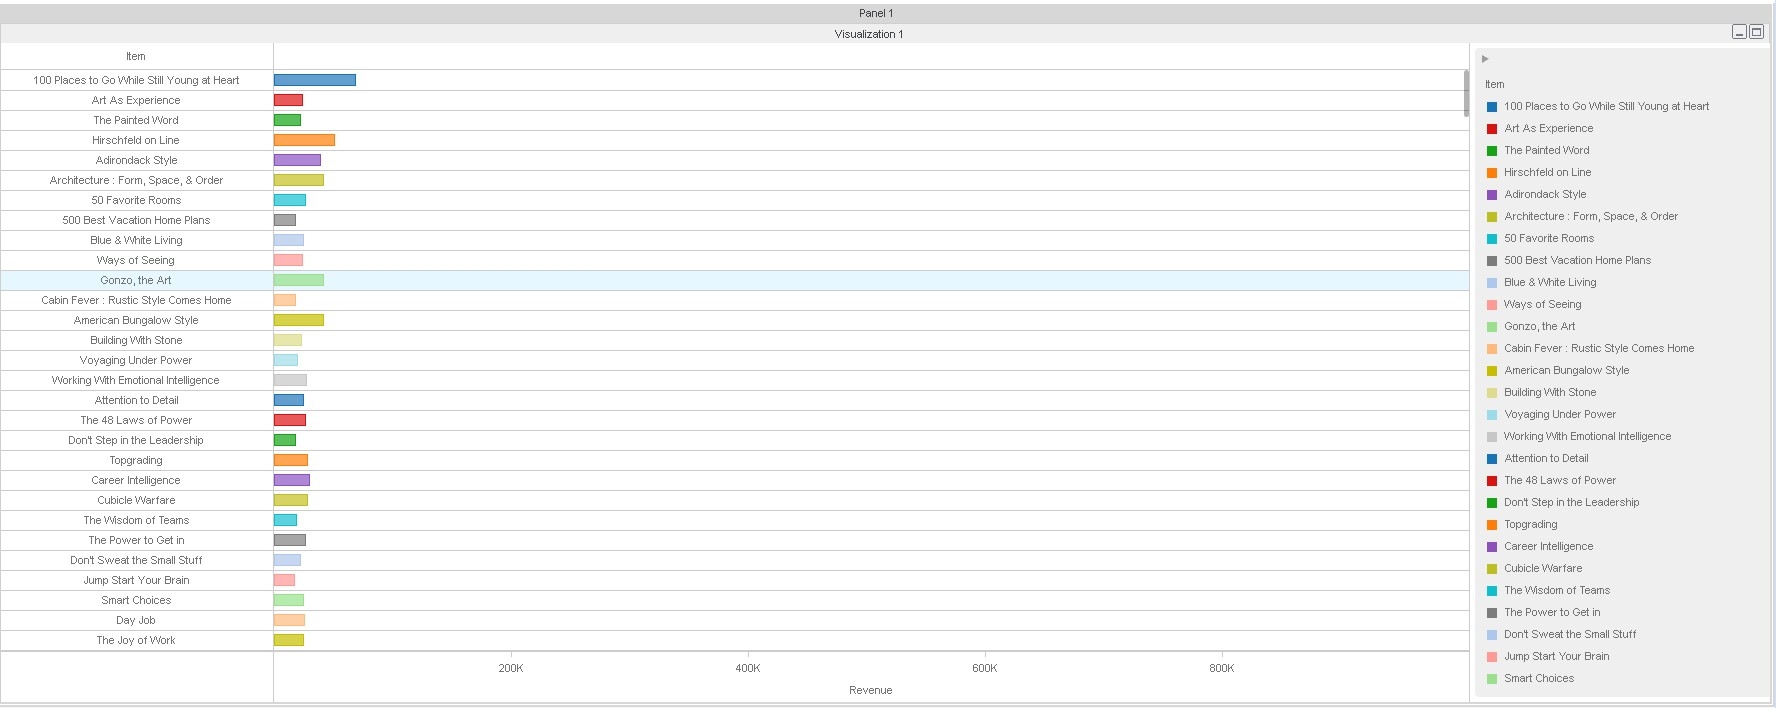
11) Go to editable mode, right mouse click and select Format > Format, expand the drop down menu, select Series Values > All Data Values and check the Show option. Click on apply to confirm the labels are enabled
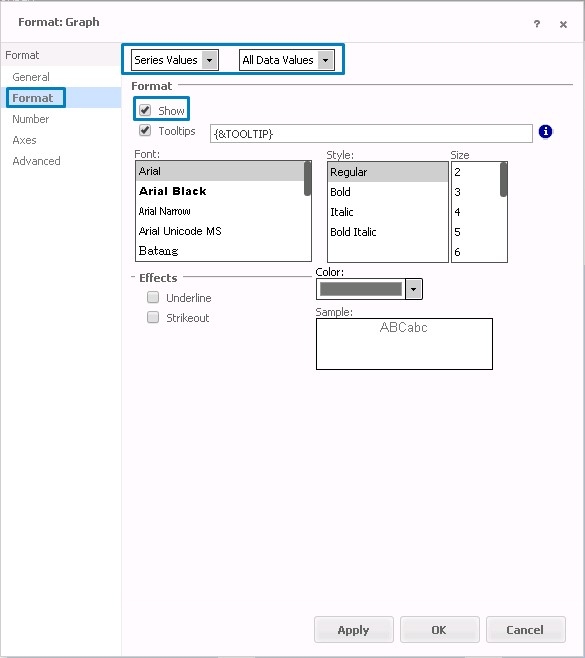
12) Run in presentation mode again to confirm the labels are not still displayed:
CAUSE
This is an identified defect in Strategy Web Universal 10.3
ACTION
There are two options to make the Graph Labels visible:
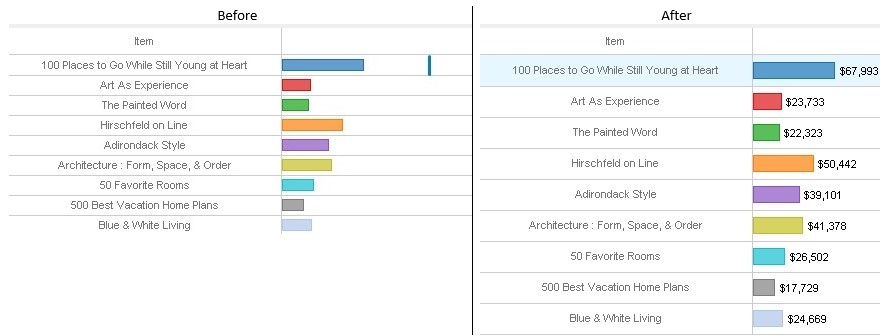
1) In Presentation view mode, increase the line height:
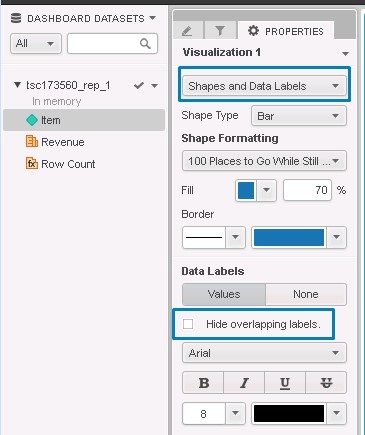
2) Before converting the Visual Insight Dashboard into Report Services Document, disable the Properties > Shapes and Data Labels > Hide overlapping labels option:
KB424029
