This technical note explain how to assign attribute elements specific colors in a static, not a dynamically-created, report/graph.
Static Reports:
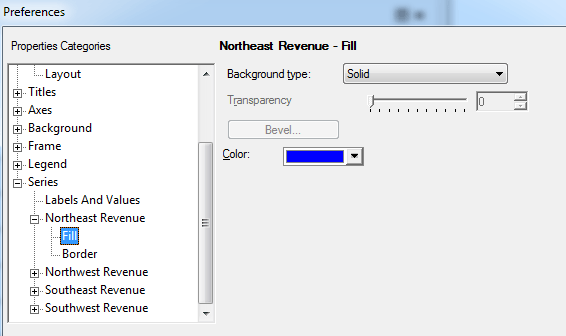
Within a static report, a user can assign a specific color to an individual attribute element by:
1. Right clicking anywhere on the graph and choosing "Graph Options."

2. Then navigate to "Series" in the left-hand column. Under each attribute element, select "Fill" and choose any color before clicking Apply or OK.
Dynamically-Created Reports:
A dynamically-created report is one in which the user utilizes selectors to pick and choose which attribute elements to display on the graph. Dynamically-created reports are most commonly seen in Dashboards. Within the Graph Options of dynamically-created graphs, the user does not see individual attribute elements listed under "Series." Instead, the customer will see Region1, Region2, Region3, etc...

Within Dynamically created graphs, a user can assign colors to a series of attributes, and not individual attribute elements. In the above example, the first Region on the graph (regardless of the attribute element) will always display as purple. Within dynamically created graphs, users are essentially assigning the order of colors displayed.
There is currently an Enhancement Request filed with Technology to assign specific colors to attribute elements on a dynamically-created report. Strategy will continue to investigate and post updates as soon as they are available.
