EducationSoftwareStrategy.com
StrategyCommunity

Knowledge Base

Product

Community

Knowledge Base

TopicsBrowse ArticlesDeveloper Zone

Product

Download SoftwareProduct DocumentationSecurity Hub

Education

Tutorial VideosSolution GalleryEducation courses

Community

GuidelinesGrandmastersEvents
x_social-icon_white.svglinkedin_social-icon_white.svg
Strategy logoCommunity

© Strategy Inc. All Rights Reserved.

LegalTerms of UsePrivacy Policy
  1. Home
  2. Topics

KB42578: A metric defined to be positioned on the primary Y axis in a dual axis clustered bar graph is moved to the secondary axis upon execution of a Report Services document in Flash mode in Web 9.x


Community Admin

• Strategy


A metric defined to be positioned on the primary Y axis in a dual axis clustered bar graph is moved to the secondary axis upon execution of a Report Services document in Flash mode in Web 9.x

SYMPTOM:
 
After defining a metric to be positioned on the primary Y axis (Y1) in a dual axis clustered bar graph, users may note that this is moved to the secondary Y axis (Y2) axis when the document is executed in Flash mode in Web 9:

ka04W000000OdvWQAS_0EM4400000026on.jpeg

 
The metric appears on the Y1 axis as anticipated, when the same document is displayed in Interactive mode:

ka04W000000OdvWQAS_0EM4400000026or.jpeg

 
STEPS TO REPRODUCE:
This behaviour can be replicated in the Strategy Tutorial project according to the following steps:
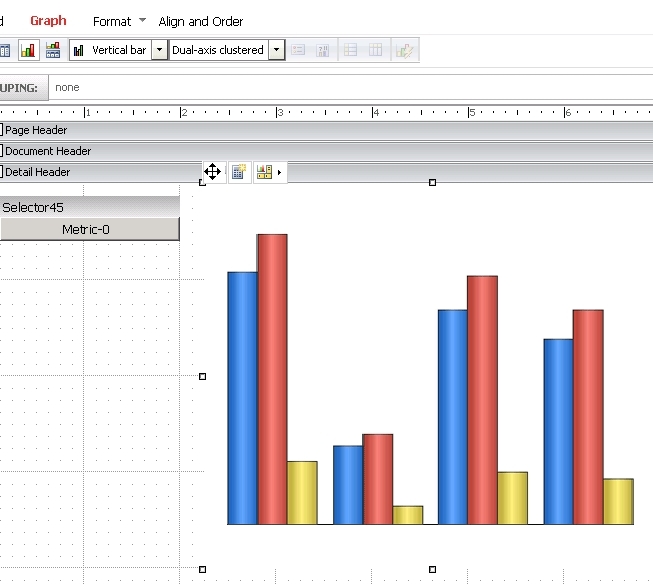
  • Create a dataset with the Month attribute and the following metrics:
    - Month
    - Revenue
    - Profit
    - Discount %
    - Discount
  • Incorporate this dataset report within a new document.
  • Add a graph to the template and select type 'Vertical Bar: Dual Axis Clustered":

ka04W000000OdvWQAS_0EM4400000026ot.jpeg
  • Within the same section of the document, create a metric selector of 'Vertical Button Bar' type:

ka04W000000OdvWQAS_0EM4400000026op.jpeg
  • Execute the document in Interactive Mode and highlight the 'Revenue', 'Discount %' and 'Discount' metrics in the selector
  • Set the 'Dual Y axis' option for the graph to have only the 'Discount %' metric on the secondary Y axis:

ka04W000000OdvWQAS_0EM4400000026od.jpeg
  • Hover over the middle of the three bars in the graph and note that no tooltip is shown
  • Switch to Flash mode and mouse over the middle of the three bars
  • Note that the tooltip now shows 'Discount %', as if this metric were included on the primary Y axis within the graph. 

CAUSE:
 
This represents a limitation when executing graphs on 'Dual Axis Clustered' type in Flash mode from Web 9.
An enhancement request has been logged to add this feature into Strategy Web.
 
ACTION:
Please contact Technical Support to request an update with regard to the status of this issue.


Comment

0 comments

Details

Knowledge Article

Published:

June 15, 2017

Last Updated:

June 15, 2017