On a graph, a user can choose to format a number like '100,000' to display as '100 K'. This is done by right-clicking the axis label and going to Graph Options and then navigating to Axes > Y > Axis Labels > Number Formatting. If the Category is 'Fixed' the user will have the option to choose an abbreviation.

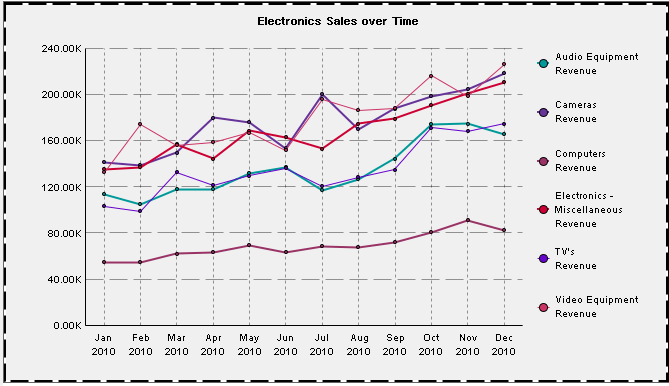
When an abbreviation is chosen, the graph will display as below. Note that the values on the Y-axis as displayed as 240.00 K instead of 240,000.
The formatting for metric values on a grid does not have the abbreviation option.

However, the same effect can be achieved by using the 'Custom' option and using code such as
0.00,,"Million";0.00,"K";0
