SYMPTOM:
Users would like to create custom banding on a metric on a Bar Graph. For example, on a profit by year graph, they would like the lowest 50% of the profit to display in red, the middle 25% of the profit to display in yellow, and the top 25% of the profit to display in green.
STEPS:
1. Create a report with the Year attribute and the Profit metric
2. Insert a derived metric that is defined as Profit * 0.25

3. Insert a second derived metric that is defined as Profit * 0.25
4. Inset a third derived metric that is defined as Profit * 0.5
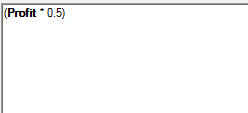
5. Remove the Profit metric from the template so only the Year attribute and the derived metrics are on the template
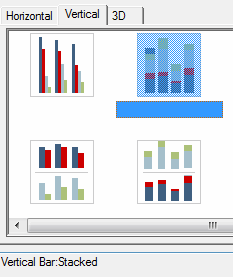
6. Run this report as a Vertical Bar:Stacked Graph
7. Right click the graph and select Graph Options.
8. In the Graph Options window, Select Options > Colors and choose the desired colors.
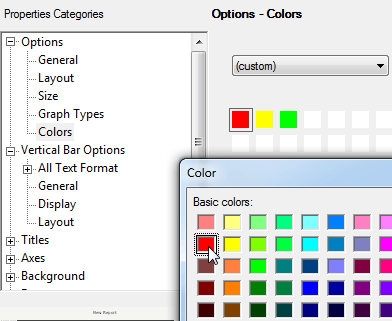
9. The graph now displays the desired bands.

