Starting in Strategy Mobile 9.3.1 The Microchart widget has a tree mode option.
The Microcharts Tree Mode widget now enables users to view a tiered analyses on their tablet device. This widget is essentially the equivalent of outline mode in a report and enables users to see the totals in a Microchart format at the different levels that it is configured.
Strategy 9.3.1 supports the use of the Light, Dark, and Custom themes when designing Microcharts. It is recommended that designers use either the Light or Dark themes as they are optimized for the display of the widget.
To configure a Microchart Tree Mode Widget, follow the next steps:
1. Create a dataset with at least three attributes and as many metrics you would like to see in the Microchart (Please refer to KB42217 to get more details on what each metric will do) As an example, using Strategy Tutorial Metadata, create a report with Category, Year, Month and Revenue.
2. Save the report and create a new document based on that report.
3. From Strategy Desktop, open the new document, add the dataset as into the document's body to create a grid, right-click on the grid and select "Edit Grid" option.
4. Click on the Subtotals button on the toolbar to open the Subtotals Editor
5. Click on the ‘Advanced’ option and with the ‘Total’ subtotal selected, click on the ‘Group by’ applied level. Then
click the ‘Add’ button and select the attributes you will like to use to group your data. For example, using the report mentioned above, Add the Category and Month Attributes, this will mean that the new subtotal will group Category at the year level.
6. Save your changes and and exit the "Edit Grid" mode
7. Select the grid to be displayed as Microchart.
8. Save and run the document in Web. If you followed the exampled above, it should look like this:
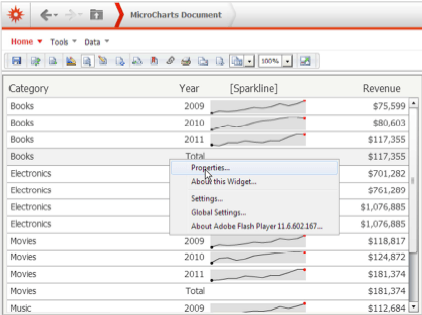
9. Right-click on the Microchart and select Properties (As the image above)
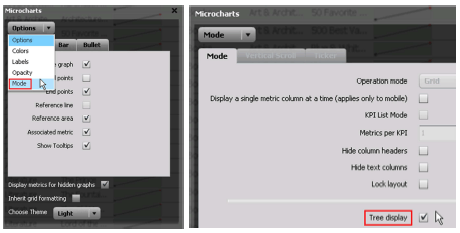
10. When the Properties window pops up, navigate through the Options menu to the ‘Mode’ screen and place a check in the ‘Tree display’ box. Then click OK.
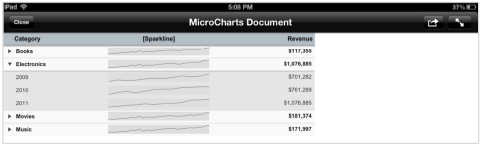
11. Save the document and run it on your mobile device. Initially, each level will be collapse so that you will only be able to see the category headers. Use your finger to expand each level
Note: To display an additional level of analysis in tree mode, simply return to Strategy Desktop (called Developer in 9.4.x and above) and add
another attribute to the original grid (i.e. Subcategory). You would then have to toggle an additional group-by
subtotal at the Category, Subcategory, and Month levels.