EducationSoftwareStrategy.com
StrategyCommunity

Knowledge Base

Product

Community

Knowledge Base

TopicsBrowse ArticlesDeveloper Zone

Product

Download SoftwareProduct DocumentationSecurity Hub

Education

Tutorial VideosSolution GalleryEducation courses

Community

GuidelinesGrandmastersEvents
x_social-icon_white.svglinkedin_social-icon_white.svg
Strategy logoCommunity

© Strategy Inc. All Rights Reserved.

LegalTerms of UsePrivacy Policy
  1. Home
  2. Topics

KB429048: Exporting Graphs to Excel lose formatting when exported to in MSTR 10.2 Developer and Web


Stefan Zepeda

Salesforce Solutions Architect • Strategy


Exporting Graphs to Excel lose formatting when exported

SUMMARY:
 
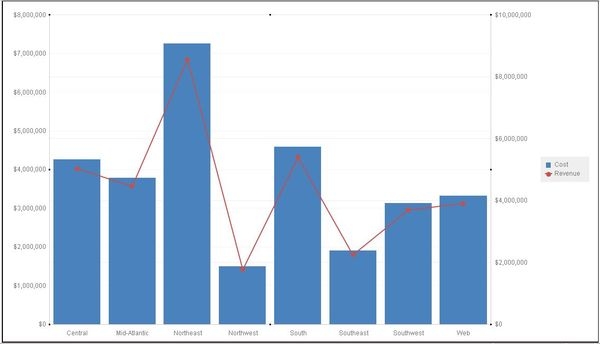
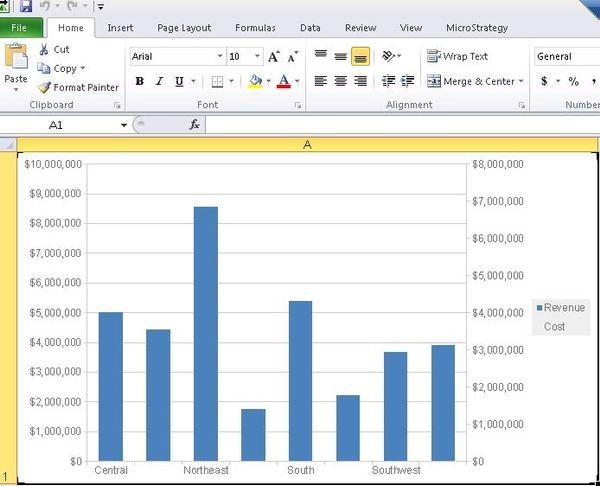
When exporting a dual axis graph to Excel, formatting and visuals may be lost during the export process. For example, when a line and bar graph is shown on a Report Services Document, the line is no longer displayed after export as seen below:
 

ka02R000000kV3OQAU_0EM440000002X4Q.jpeg
ka02R000000kV3OQAU_0EM440000002X4U.jpeg

STEPS TO REPRODUCE:
In Tutorial 10.2

  1. Create a new report with cost, revenue, and region
  2. Change to graph view
  3. Right click on the graph and modify the graph options
  4. Within vertical bar options, check the "Dual Axis" option
  5. Within "Series" drop down, change one metric series to "Line"
  6. Save and close the report
  7. Create a new RS document that utilizes the report
  8. Add the report to the "Detail Header" section
  9. Run the dashboard
  10. Export the Dashboard to Excel (On VM 2010 was used)
  11. Notice that the line portion is missing
  12. Export from web yields same behavior

 
CAUSE:
This issue has been logged as a defect.
WORKAROUND:
Use embed bitmap instead of live chart when exporting to Excel. Edit document, go to Tools > Document properties, change graph format in export setting to “Use embedded bitmaps”
The reference number for this article is 
KB429048


Comment

0 comments

Details

Knowledge Article

Published:

March 23, 2018

Last Updated:

December 12, 2018