In Strategy Web 9.3.1 and up, a new Graph Type has been introduced called Budgeting graphs. This Graph Type consists of the following four SubTypes:
The purpose of this Graph Type is to analyze ‘actual’ versus ‘expected’ values. The Lipstick and Overlapping Subtypes only provide slightly different methods of viewing this data.
Dataset template requirements:
In the following example, the gray bar is for the actual recorded value and the "expected" or "targeted" is represented by additional red/green bars. When the expected value exceeds the actual value, this additional bar is placed on top of the actual value bar, where the additional bar totals the difference between expected and actual. If the actual value exceeds the expected value, the additional bar resides within the actual value bar.
Lipstick Graph
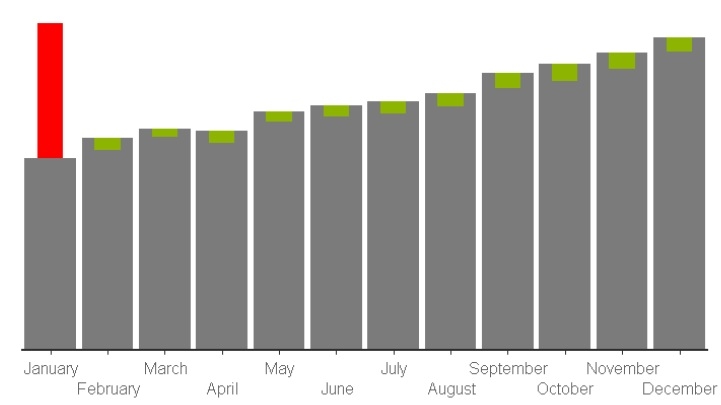
For the Overlapping Graph, the "actual" metric value is displayed as the gray bar and the "expected" or "targeted" value is displayed behind and overlapped by the corresponding "actual" metric:
Overlapping Graph

