EducationSoftwareStrategy.com
StrategyCommunity

Knowledge Base

Product

Community

Knowledge Base

TopicsBrowse ArticlesDeveloper Zone

Product

Download SoftwareProduct DocumentationSecurity Hub

Education

Tutorial VideosSolution GalleryEducation courses

Community

GuidelinesGrandmastersEvents
x_social-icon_white.svglinkedin_social-icon_white.svg
Strategy logoCommunity

© Strategy Inc. All Rights Reserved.

LegalTerms of UsePrivacy Policy
  1. Home
  2. Topics

KB43186: How super-impose two graphs with independent datasets in a document in Microstrategy 9.4.X


Stefan Zepeda

Salesforce Solutions Architect • Strategy


This article describes how to super-impose two graphs on top of each other.

How super-impose two graphs with independent datasets in a document
The following procedure describes how to super-impose two graphs on top of each other. Each graph can have its own dataset.
1. Add two datasets to a document
2. Add one graph based on one dataset as Bar graph and add another Line graph based on the other dataset.
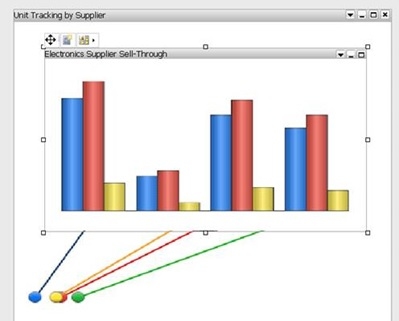
3. Put one graph onto the other one to overlap, as shown below:
ka02R000000kXJDQA2_0EM440000002Cr8.jpeg

4. Open the above graph Properties and formatting editor, change the fill color to "No Fill"
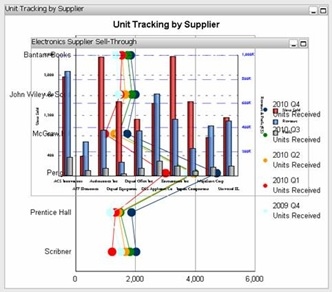
5. Switch to Flash mode, you should see two graphs overlapped, as shown below:
ka02R000000kXJDQA2_0EM440000002Cr5.jpeg

Comment

0 comments

Details

Knowledge Article

Published:

June 19, 2017

Last Updated:

June 19, 2017