EducationSoftwareStrategy.com
StrategyCommunity

Knowledge Base

Product

Community

Knowledge Base

TopicsBrowse ArticlesDeveloper Zone

Product

Download SoftwareProduct DocumentationSecurity Hub

Education

Tutorial VideosSolution GalleryEducation courses

Community

GuidelinesGrandmastersEvents
x_social-icon_white.svglinkedin_social-icon_white.svg
Strategy logoCommunity

© Strategy Inc. All Rights Reserved.

LegalTerms of UsePrivacy Policy
  1. Home
  2. Topics

KB43229: "Report Service Document Validator failed" error message appears when running a Report Services document and configuring Tooltip as {&TOOLTIP} to a graph in MicroStrategy Web 9.x


Community Admin

• Strategy


The error "An error has occurred on this page. Your request could not be process. Please try again. If the problem persists, contact the Administrator. (Report Services Document Validator failed. Internal Error: DSSDocumentDataPreparationTask::Run): Error populating views info, job 8, Error Code=-2147213350)" occurs when a tooltip is configured in the Properties and Formatting > General section for a graph.

SYMPTOM:
In Strategy Web 9.x, create a Report Services document, and configure Tooltip as {&TOOLTIP} in the Properties and Formatting of its graph, as shown below:

ka04W000000Odg1QAC_0EM4400000026iP.png

When running the document in any mode, the following error message appears:

ka04W000000Odg1QAC_0EM4400000026iY.png


An error has occurred on this page.
Your request could not be process. Please try again. If the problem persits, 
contact the Administrator.
(Report Services Document Validator failed. Internal Error: 
DSSDocumentDataPreparationTask::Run): Error populating views info, job 8, 
Error Code=-2147213350)
 
CAUSE:
The auto text {&TOOLTIP} is configured incorrectly.
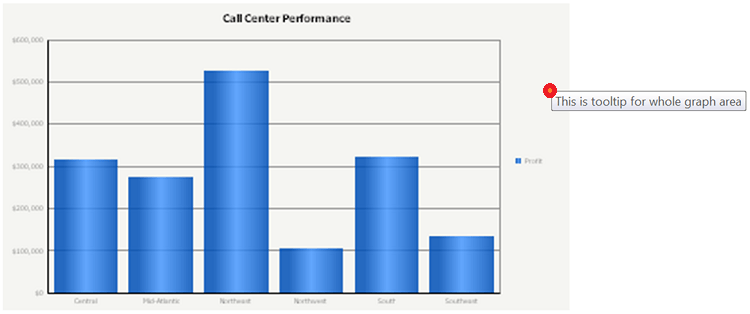
In Properties and Formatting, only plain text is supported. Any text in this area is used as tooltip for whole graph area, as shown below:

ka04W000000Odg1QAC_0EM4400000026iU.png

{&TOOLTIP} macro can only be used in Graph Series.
ACTION 

  • In Editable Mode of the document, right-click graph, choose "Format";
  • In Format: Graph window, navigate to "Format" option;
  • In Drop down list, choose "Series Value", choose desired Series and type {&TOOLTIP}, as shown below:
ka04W000000Odg1QAC_0EM4400000026iQ.png

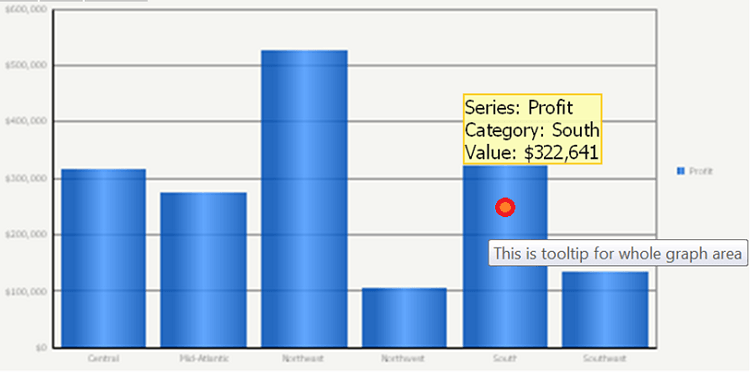
Now auto Tooltip for data can be displayed, as shown below:
ka04W000000Odg1QAC_0EM4400000026iV.png


Comment

0 comments

Details

Knowledge Article

Published:

April 6, 2017

Last Updated:

April 6, 2017