EducationSoftwareStrategy.com
StrategyCommunity

Knowledge Base

Product

Community

Knowledge Base

TopicsBrowse ArticlesDeveloper Zone

Product

Download SoftwareProduct DocumentationSecurity Hub

Education

Tutorial VideosSolution GalleryEducation courses

Community

GuidelinesGrandmastersEvents
x_social-icon_white.svglinkedin_social-icon_white.svg
Strategy logoCommunity

© Strategy Inc. All Rights Reserved.

LegalTerms of UsePrivacy Policy
  1. Home
  2. Topics

KB43343: Vertical and Horizontal bar graphs do not display all element when the data is of type big decimal in MicroStrategy Web Visual Insight 9.3 - 9.4.


Community Admin

• Strategy


Vertical and Horizontal bar graphs do not display all element when the data is of type big decimal in MicroStrategy Web Visual Insight 9.3 - 9.4.

SYMPTOM:
 
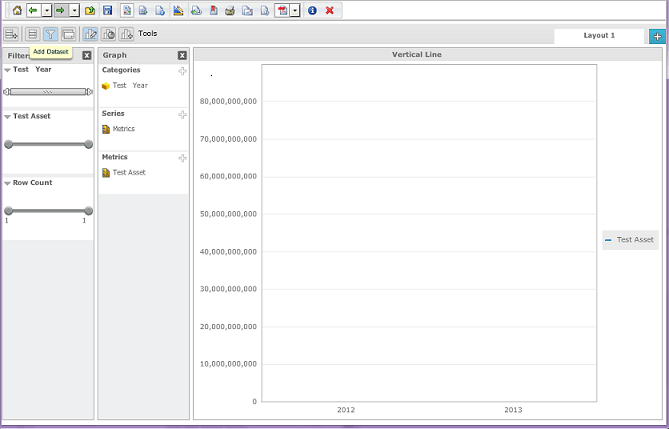
When creating a bar chart visualization in Visual Insight 9.3 - 9.4 with Big Decimal data, the data does not display in the bar chart, even though it displays in Strategy Web and Strategy Desktop 9.3 - 9.4.
 
STEPS TO REPRODUCE
 
Follow these steps to reproduce in Strategy Tutorial, with an Oracle 11g Data Warehouse (at least one table from the warehouse should be added to the project):
 
SQL
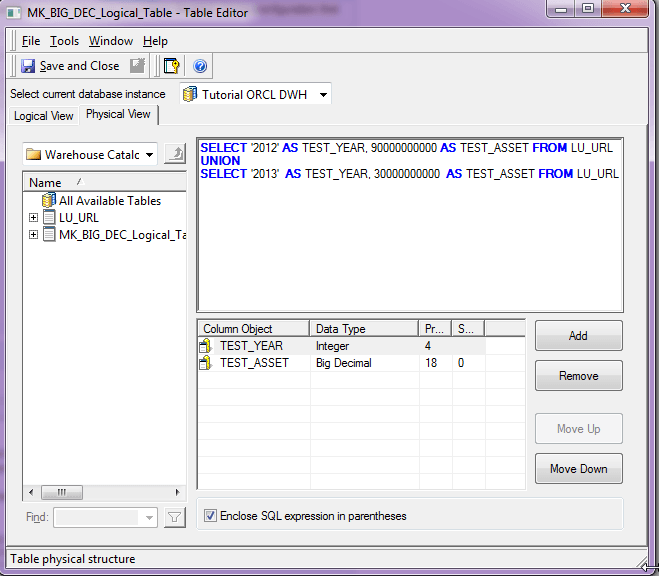
SELECT '2012' AS TEST_YEAR, 90000000000 AS TEST_ASSET FROM LU_MONTH UNION SELECT '2013'  AS TEST_YEAR, 30000000000  AS TEST_ASSET FROM LU_MONTH 
 
In the screenshot below, the logical table is named "MK_BIG_DEC_Logical_Table" and the table used from the data warehouse is "LU_URL".
 

ka04W000000OgXLQA0_0EM4400000026hf.png


ka04W000000OgXLQA0_0EM4400000026hh.png


ka04W000000OgXLQA0_0EM4400000026hc.png


ka04W000000OgXLQA0_0EM4400000026hu.png


ka04W000000OgXLQA0_0EM4400000026hx.png


Bar Graph:

ka04W000000OgXLQA0_0EM4400000026hv.png

 
Line Graph:

ka04W000000OgXLQA0_0EM4400000026hg.png


ka04W000000OgXLQA0_0EM4400000026ht.png

 
Additionally, when viewing as a line graph, the visualization is blank:
 

ka04W000000OgXLQA0_0EM4400000026hw.png


  1. Create a logical table with the following definition and call it TEST_ASSET:
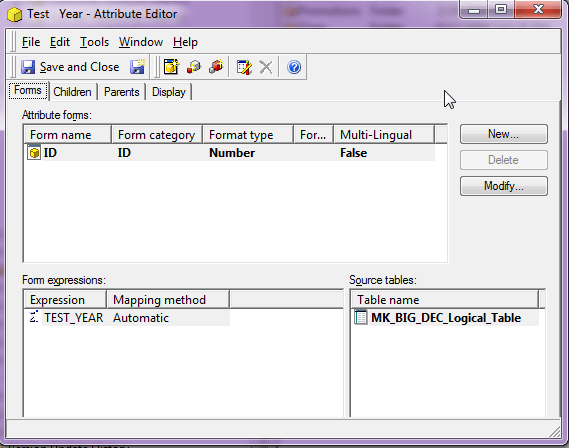
  2. Create an attribute called TEST YEAR based on the column TEST_YEAR from the logical table, as shown below.
  3. Create a fact called Test Asset based on the TEST_ASSET column from the logical table, like shown below.
  4. Create a metric called Test Asset as Sum() {~}, like shown below.
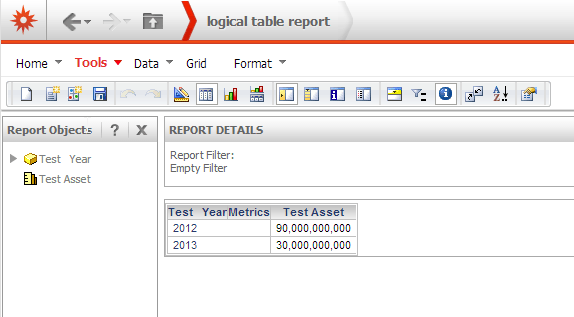
  5. Create a report using the attribute Test Year and the metric Test Asset, like shown below.
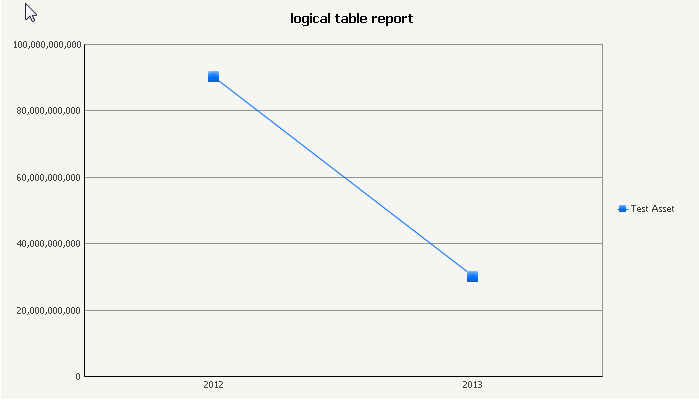
  6. Note that in Strategy Web 9.3.0, the report can be viewed as a graph without any issues:
  7. Create an analysis on visual insight object with the bar graph visualization. See that the 2012 element is not shown:

CAUSE:
 
This is a known issue in Strategy Web Visual Insight 9.3 - 9.4. 
 
ACTION:
 
Issue has been addressed in version 9.5.1 and newer versions of Strategy. Please upgrade to these versions to take advantage of the fix.


Comment

0 comments

Details

Knowledge Article

Published:

June 16, 2017

Last Updated:

June 16, 2017