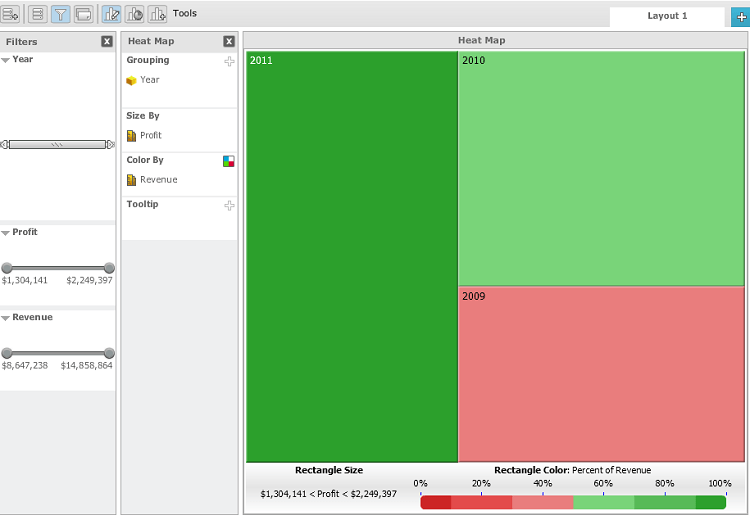
This is an example on how to return a Strategy Visual Insight report back to its original form after drilling down to a specific level. This example is done with a Heat Map analysis.
1. Create a Strategy Report with Year, Region, Profit and Revenue
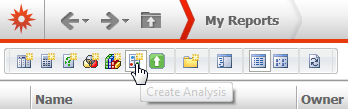
2. Create Analysis by clicking on the button below and navigating to the Report:
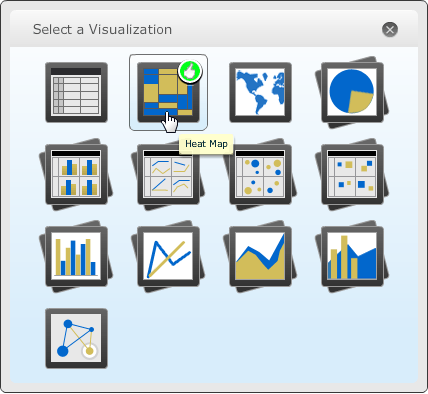
3. Select Heat Map as shown below:
4. The Heat Map should resemble as below:

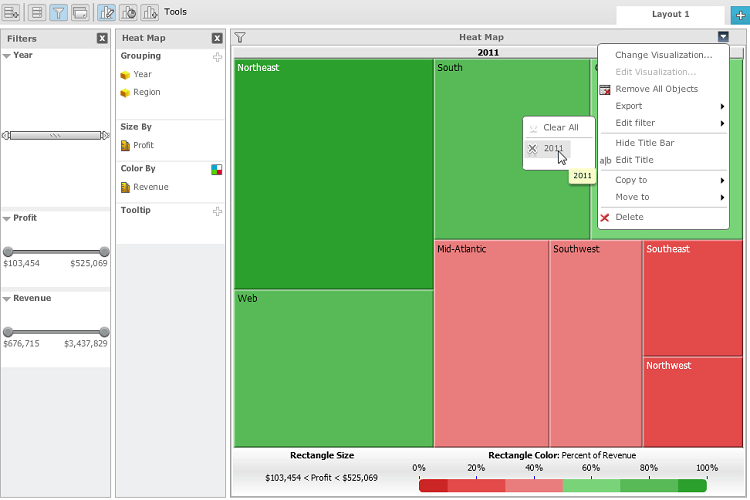
5. Drill to Region on the year 2011 as shown below:
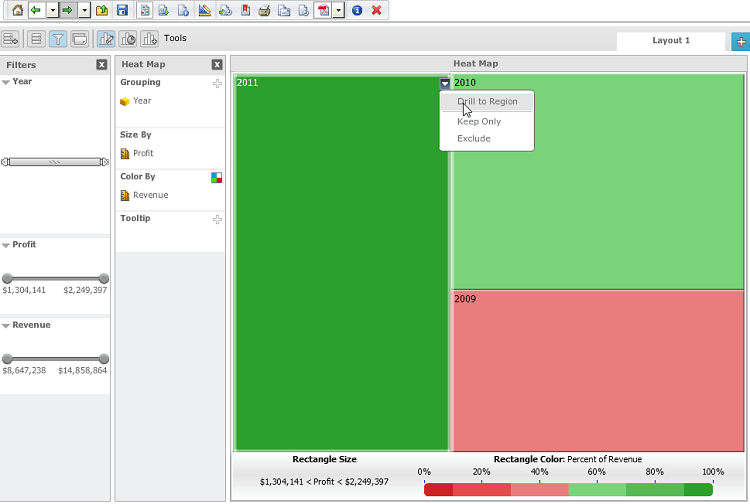
6. The Heat Map should resemble as below after drilling to Region on 2011. To return to the Original Heat Map follow the menu options below and remove 2011.
7. Remove Region from the Heat Map pane as shown below:
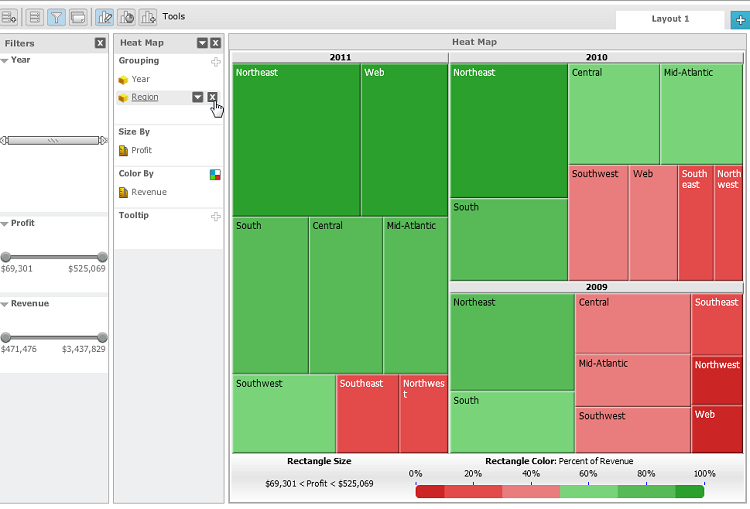
8. The Heat Map will then return back to the original analysis.