EducationSoftwareStrategy.com
StrategyCommunity

Knowledge Base

Product

Community

Knowledge Base

TopicsBrowse ArticlesDeveloper Zone

Product

Download SoftwareProduct DocumentationSecurity Hub

Education

Tutorial VideosSolution GalleryEducation courses

Community

GuidelinesGrandmastersEvents
x_social-icon_white.svglinkedin_social-icon_white.svg
Strategy logoCommunity

© Strategy Inc. All Rights Reserved.

LegalTerms of UsePrivacy Policy
  1. Home
  2. Topics

KB43516: How to display a numerical Subtotal value for each bar in a stacked bar graph in Microstrategy Developer 9.x.


Stefan Zepeda

Salesforce Solutions Architect • Strategy


How to display a numerical Subtotal value for each bar in a stacked bar graph in Microstrategy Developer 9.x

The following procedure shows how to display Subtotals as clean, numerical text for each bar in any Strategy Developer stacked bar graph, using the Tutorial project for demonstration purposes.
 
1. Create a report with 'Year' attribute on rows and 'Category' attribute and 'Revenue' metric on the column as shown below:


ka02R000000kX62QAE_0EM440000002CoK.png

 
2. Run the report and add the Subtotal by going to Data menu -> Grand Totals. The output the report is shown below:


ka02R000000kX62QAE_0EM440000002CoM.png

 
3. Go to the Graph view and select either the 'Vertical Bar: Stacked' or the 'Horizontal Bar: Stacked' graph type. In this example, 'Vertical Bar: Stacked' will be used.
4. Go to Graph menu -> Graph options -> Options check the 'Show subtotals in the graph' checkbox if it is not already checked
.
         

ka02R000000kX62QAE_0EM440000002CoN.png

 
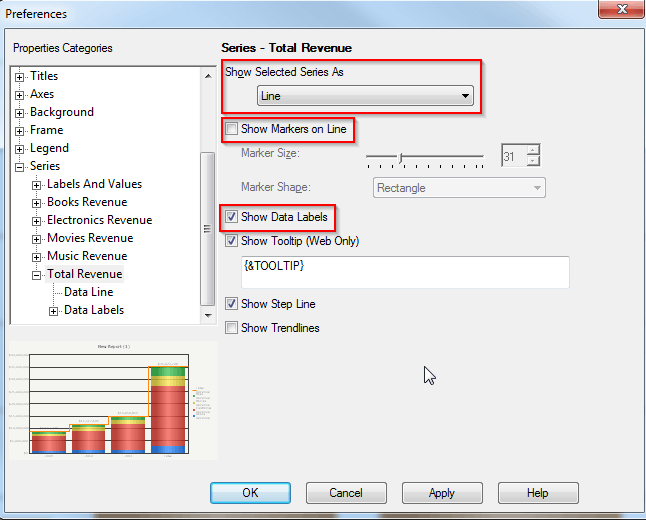
5. Go to Series -> Total Revenue. Change the Show Selected Series As 'Line' from the dropdown menu, uncheck 'Show Markers on Line', and check  'Show Data Labels'.


ka02R000000kX62QAE_0EM440000002CoD.png

 
6. Finally, go to Series -> Total Revenue -> Line, and set Transparency to 100, as shown below. Press OK.


ka02R000000kX62QAE_0EM440000002Co9.png

 
7. The graph should display as shown below.


ka02R000000kX62QAE_0EM440000002CoB.png

 
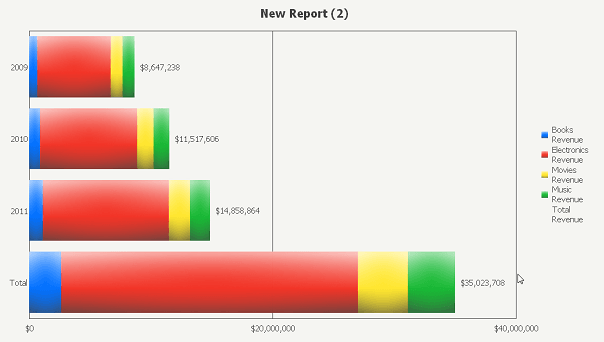
By following the same steps as above for a horizontal stacked bar graph, the graph will display as follows:


ka02R000000kX62QAE_0EM440000002CoF.png


Comment

0 comments

Details

Knowledge Article

Published:

April 10, 2017

Last Updated:

April 10, 2017