SYMPTOM:
Some data labels are not displayed on a graph matrix visualization in Visual Insight in Strategy Web 9.x.
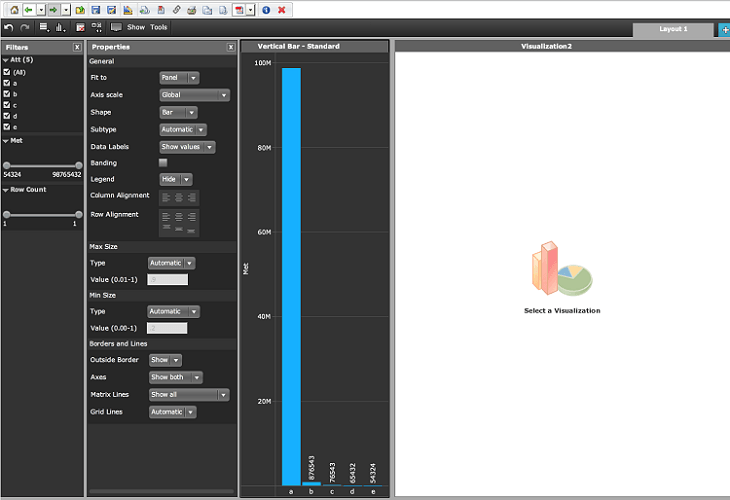
In the graph matrix visualization below, the first bar element does not show the data label:
STEPS TO REPRODUCE:
CAUSE:
This is behaving as designed. Since the area for the visualization is limited, the labels adjust to display vertically instead of horizontally. In addition, data labels require a 5 pixel padding between the data label and the graph container border to be displayed, otherwise the label is dropped. In this case the bar is so close to the top border of the container that it does not have enough space to display completely so the label is dropped.
ACTION:
Modify the Y axis scale on the visualization to a custom max value to allow for the end of the bar to be far below the container's boarder so the data label can be displayed.
