EducationSoftwareStrategy.com
StrategyCommunity

Knowledge Base

Product

Community

Knowledge Base

TopicsBrowse ArticlesDeveloper Zone

Product

Download SoftwareProduct DocumentationSecurity Hub

Education

Tutorial VideosSolution GalleryEducation courses

Community

GuidelinesGrandmastersEvents
x_social-icon_white.svglinkedin_social-icon_white.svg
Strategy logoCommunity

© Strategy Inc. All Rights Reserved.

LegalTerms of UsePrivacy Policy
  1. Home
  2. Topics

KB43783: How to configure a Time Series Slider widget in order to have Dual-axis enabled in MicroStrategy Web 9.x


Community Admin

• Strategy


How to configure a Time Series Slider widget in order to have Dual-axis enabled in MicroStrategy Web 9.x

SYMPTOM:
 
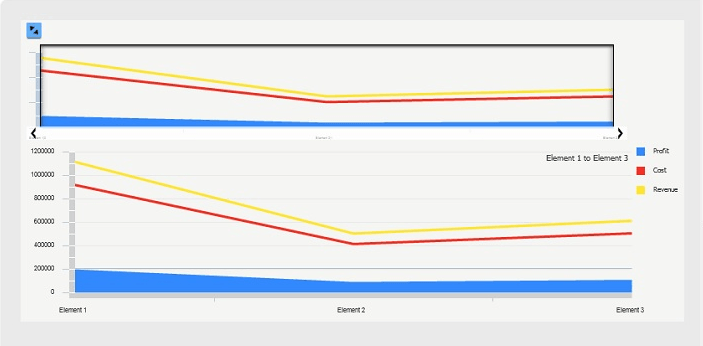
By  default, the Time Series Slider widget does not have Dual-axis enabled  in Strategy Web 9.x, as shown:
ka04W000000Oh6sQAC_0EM4400000026e4.png

 
ACTION:
Follow the steps below in order to enable Dual-axis to the Time Series Slider widget.
 
1) In Design or Editable modes, define the underlying graph to the Time Series Slider widget as a Dual-axis subtype, as shown. To perform this action, select the graph and in the Graph menu change the second dropdown box, selecting the desired graph subtype. In this example, Vertical Bar: Dual-axis stacked and Combination: Dual Axis Bar Area:

ka04W000000Oh6sQAC_0EM4400000026e2.jpeg

 
2 – In Flash mode, right click on the widget and select the Properties option.
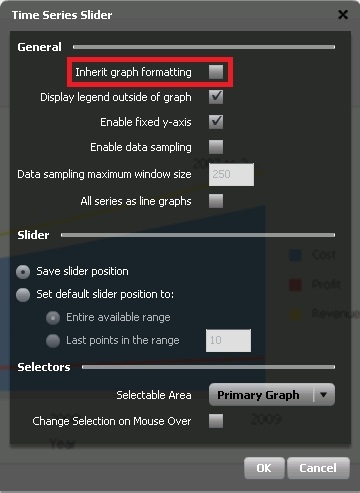
3 – Check the box “Inherit graph formatting” as in the picture below:
ka04W000000Oh6sQAC_0EM4400000026dy.jpeg

NOTE:
This option is not enabled by default, so the changes in the graph properties will not be reflected in the widget until this option is checked.
 
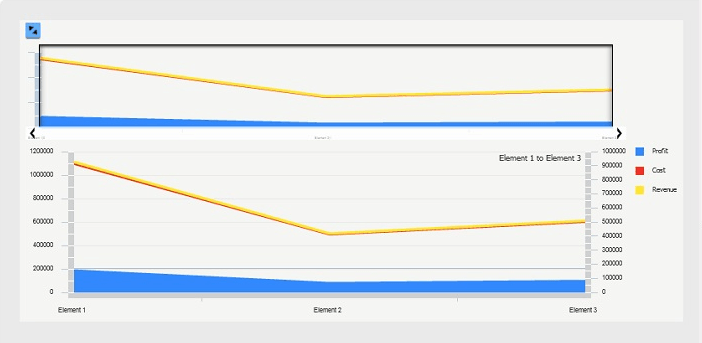
4 – After enabling this option, the Time Series Slider widget is displayed with Dual-axis enabled, as shown:
ka04W000000Oh6sQAC_0EM4400000026do.png


Comment

0 comments

Details

Knowledge Article

Published:

June 2, 2017

Last Updated:

June 2, 2017