HTML5 is overtaking Adobe Flash as the technology of choice for creating and delivering interactive content across a variety of interfaces and operating systems. Even Adobe is following this trend by rewriting Flash Professional to incorporate native HTML5 support and announcing that it will rename its authoring tool to Adobe Animate CC early next year. Therefore, Strategy has made efforts to reduce the dependency on Adobe Flash in its products. This began with the 9.0.2 release, which introduced Express Mode for Report Services documents. More recently, the release of Strategy 10 replaced the use of Flash in Web and Strategy Desktop with HTML5. Version 10.1 goes even further by “deprecating” the use of Interactive and Flash modes for Report Services documents. Deprecation means that the functionality is still available but Strategy encourages its customers to use alternatives. With the goal of providing a simpler user experience, Strategy 10.1 consolidated multiple different view modes (Interactive Mode, Flash Mode, and Express Mode) into a single consumption-optimized view mode. Edit Mode is now the default mode for authoring documents. The new Presentation Mode utilizes HTML5 and features enhanced performance and a cleaner look and feel. The old Flash functionality is still available but users are encouraged to use HTML5-based alternatives.
This document describes what to expect when upgrading existing Flash-based content from 9.x to 10.x. It includes best practices for replacing Flash widgets with non-Flash alternatives and makes recommendations for authoring new interactive documents and dashboards in 10.x.
Upgrading Flash-based content from 9.x to 10.x
When upgrading from version 9.x to 10.x, Flash-based content will continue to work without loss of functionality, and dashboards built in 9.x are automatically updated to use HTML5 in 10.x.
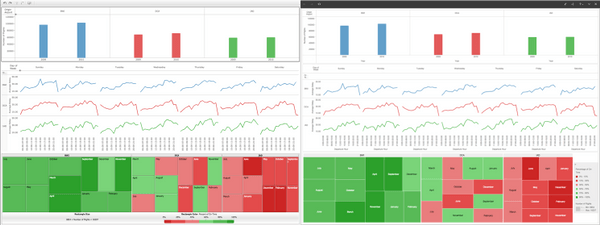
A Flash ad hoc dashboard (left) automatically rendered in HTML5 (right) in 10.x, with zero manipulation.Until Strategy retires the use of Flash for documents, existing Flash-based documents will continue to display in their default view mode. For any existing document that is displayed in Interactive Mode or Flash Mode by default:
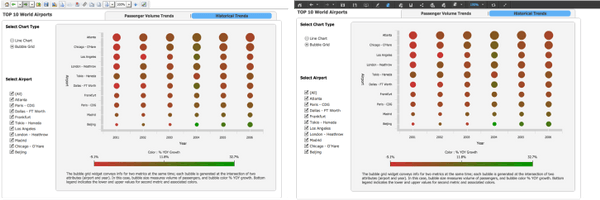
A document made pre-9.4.1 (left) will continue to display in Flash in 10.x (right).
Documents can still be exported to Flash for offline interactive analysis. If “Export to Flash” is enabled for an existing document, the export option (renamed to “Flash (deprecated)”) will still be available through the unified Presentation Mode of the document. While exporting to Flash as a .mht file is still supported, a change introduced by Adobe in Flash Player 19 has caused an issue with the consumption of .mht exports. A workaround exists that requires customers to use PDF export with embedded Flash instead. See tech note KB262566 for further details.
Using Strategy Developer, the deprecated Interactive or Flash modes can still be enabled as the default view mode for both existing and new documents.
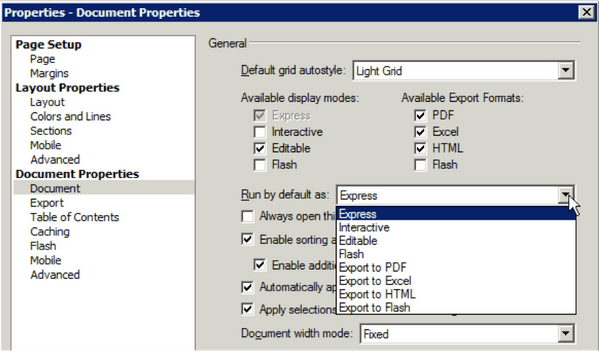
Export to Flash can be enabled through Developer for any specific document. It is disabled by default for new documents. If the functionality needs to be enabled for all new documents, then the definition of the document template can be updated in the Object templates > Documents folder.
While existing documents based on Flash Mode and documents using Flash widgets will continue to run using Flash, Strategy urges customers to migrate these documents to Presentation Mode by replacing Flash widgets with corresponding DHTML widgets or graphs (see the next section for best practices).
In certain cases, customers may also decide to rebuild an existing document as a dashboard to take advantage of functionality and features not available in documents. Dashboards have a modern look and feel, and provide a streamlined design experience that makes it easy to modify, rearrange, and resize visualizations.
Migrating existing documents from Flash to alternatives
Flash widgets were originally designed in a different era. We are using this opportunity to reassess each widget individually and redesign some based on current industry best practices and standards, particularly HTML5. In the meantime, potential alternatives to existing Flash widgets have been suggested below. These alternatives may not have direct parity with Flash widgets in 10.2 and are not meant to fully replace the existing widgets.
Suggested alternative DHTML widgets for Flash widgets
Flash Widget | DHTML Widget | Conversion Rules and Comments |
Date Selection | Date Selection | Ensure existing widget is enabled to display in DHTML mode. |
Graph Matrix (deprecated) | Graph Matrix | Secondary lines and reference lines are not available. |
Heat Map (deprecated) | Heat Map | Change the widget type to Heat Map, under DHTML. |
Map | Map | Ensure the existing widget is enabled to display in DHTML mode. |
Network | Network | Ensure the existing widget is enabled to display in DHTML mode. |

Flash Map widget (left) and the same widget in DHTML (right).
Rules for replacing Flash widgets with Graphs
If elements do not display, in the Graph toolbar, configure the new graph to display additional categories.
Flash Widget | Graph | Conversion Rules and Comments |
Funnel | Funnel | Add a new Funnel graph using these specifications: |
Interactive Bubble Graph | Bubble | Add a new Bubble graph using these specifications: To simulate the in-widget attribute slider, add a new selector to your document and choose the Slider DHTML style. Target the new Bubble graph. You cannot color bubbles by an attribute in a Bubble Graph. |
Interactive Stacked Graph | Vertical Area | Add a new Vertical Area graph using these specifications: Set the graph sub-type to Stacked in the Graph toolbar. To simulate the in-widget attribute element checkbox, add a new selector to your document and choose the Check Boxes DHTML Style. Target the new Vertical Area graph. |
Time Series Slider | Vertical Area | Add a new Vertical Area graph using these specifications: Consider replacing the in-widget time-range selector with a Slider selector. |
Recommendations for replacing Flash widgets with selectors
Flash Widget | Selector | Conversion Rules and Comments |
Date Selection | Calendar | The Calendar selector enables you to choose a date range. |
Fish Eye | Listbox | Consider disabling the option for All and allowing only a single selection. |
When to rebuild a document as a dashboard
In some cases, it may be preferable to rebuild a document using an HTML5 dashboard. New dashboard visualizations are built using modern HTML5 technology, and provide a more modern look and feel than the graphs available in documents. The following guidelines should be used when considering whether or not to rebuild a document as an HTML5 dashboard:
| Rebuild as an HTML5 dashboard if: | Don’t rebuild in an HTML5 dashboard if: |
Visualizations | You want to take advantage of HTML5 visualizations, which have a more modern look and feel. However, HTML5 dashboards have fewer visualizations available out of the box. Dashboards can be considered if the original document uses the following visualization types: | You need the breadth of visualizations available in documents. |
Layout | The document layout has no overlapping panels within a page. Also, the document is designed to fit on one screen. | The document layout has overlapping panels. The document is designed to be longer or wider than a single screen. |
Design and Maintenance | Your documents are modified often. Dashboard design workflow is streamlined. If your dashboards constantly need to be modified, then you may find it easier to redesign your document as a dashboard compared to a document. | Your documents do not need to be modified often. Although documents have more powerful design capabilities than dashboards, you may find that it takes more time to modify a document. This is not an issue if your dashboards do not need to be modified often. |
Rules for replicating Flash widgets with HTML5 dashboard equivalents
If your document is rebuilt in a dashboard, the following rules should be used to replicate the document widgets using dashboard visualizations.
To follow these rules, you must first create a new dashboard, then add the report or cube used in the original document's widget to the dashboard. Conversion rules descibe where attributes in the original widget's underlying dataset (grid) should be placed in the new dashboard visualization.
Flash Widget | Flash Widget | Conversion Rules |
Bubble Grid | Bubble |
|
Date Selection | Filter (Calendar) |
|
Fish Eye | Filter (List Box) |
|
Interactive Bubble Graph | Bubble Chart with Filter (Slider) | To simulate the slider selector: |
Interactive Stacked Graph | Area Chart with Filter (Check Box) | To simulate the check box selector: |
Heat Map | Heat Map |
|
Map | Map |
|
Network | Network |
|
Time Series Slider | Area Chart with a second Area Chart as a selector | To simulate using another time series as a time-range selector: |
Weighted List Viewer | Bar Chart with Grid |
|

A Flash Time Series Slider widget (left) re-created in an HTML5 dashboard (right).
Recommendations for authoring new interactive content in 10.x
As of 10.1, when you create a new document in Web, the deprecated Interactive Mode and Flash Mode are no longer available as display modes or default view modes.
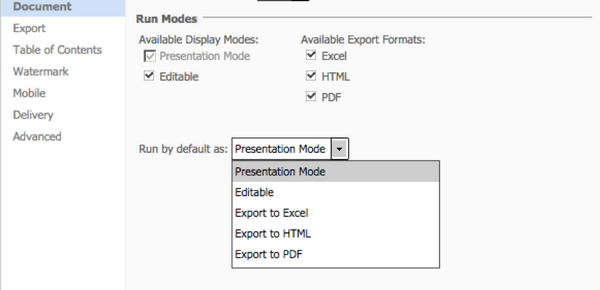
Strategy recommends that customers create new documents with the default Presentation Mode in Web and avoid using Flash Mode and Flash widgets by creating documents using Developer.
While dashboards and Desktop do not yet support all the formatting and layout options available in documents, they enable the quick and easy creation of highly polished and interactive dashboards. Consider using dashboards or Desktop for authoring interactive dashboards in the following scenarios:
In cases where a new dashboard is authored using dashboards as the starting point but additional functionality from documents is required, the dashboard can be converted to a document. Once converted, each element of the dashboard is displayed as a document control (that is, an object on the document). For example, a Heat Map visualization is displayed as a Heat Map widget, and sheets within a dashboard are displayed as document layouts.
KB438423
