EducationSoftwareStrategy.com
StrategyCommunity

Knowledge Base

Product

Community

Knowledge Base

TopicsBrowse ArticlesDeveloper Zone

Product

Download SoftwareProduct DocumentationSecurity Hub

Education

Tutorial VideosSolution GalleryEducation courses

Community

GuidelinesGrandmastersEvents
x_social-icon_white.svglinkedin_social-icon_white.svg
Strategy logoCommunity

© Strategy Inc. All Rights Reserved.

LegalTerms of UsePrivacy Policy
  1. Home
  2. Topics

KB43844: How to create a metric that displays the average subtotal value for each attribute row in MicroStrategy 9.x?


Stefan Zepeda

Salesforce Solutions Architect • Strategy


How to create a metric that displays the average subtotal value for each attribute row in MicroStrategy 9.x?

SYMPTOM:
 
The user has created a report with the quarter attribute, the cost metric, and the average subtotal as seen below:
 

ka02R000000kahWQAQ_0EM440000002Clf.png

 
The user would like to create a metric that displays the average subtotal value for each quarter.
 
STEPS TO REPRODUCE:
 
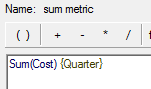
1. Create a Sum(Cost) metric with the level set to Quarter and grouping set to none.
 

ka02R000000kahWQAQ_0EM440000002Cm6.png


ka02R000000kahWQAQ_0EM440000002Cm4.png

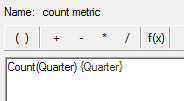
2. Create a second metric defined as Count(Quarter)  with the level set to Quarter and grouping set to none.
 

ka02R000000kahWQAQ_0EM440000002Clj.png


ka02R000000kahWQAQ_0EM440000002Cli.png

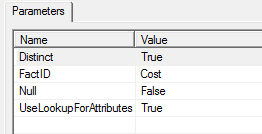
3. In the metric definition, Right click the Count function and select Count parameters. Set the Distinct parameter to true and the Fact ID parameter to use the desired fact table.
 

ka02R000000kahWQAQ_0EM440000002Clg.png

4. Create a third metric that is the first metric divided by the second metric. This will give the average subtotal for each quarter row as seen below:
 

ka02R000000kahWQAQ_0EM440000002Clh.png


ka02R000000kahWQAQ_0EM440000002Cld.png


Comment

0 comments

Details

Knowledge Article

Published:

April 6, 2017

Last Updated:

April 6, 2017