Starting with the release of Strategy ONE (March 2024), dossiers are also known as dashboards.
SYMPTOM
Cross joins are seen in metrics when joining across unrelated attributes inside of data blending. For example, tutorial datasets may contain unrelated attributes and cross join metric values rather than joining the metric values.
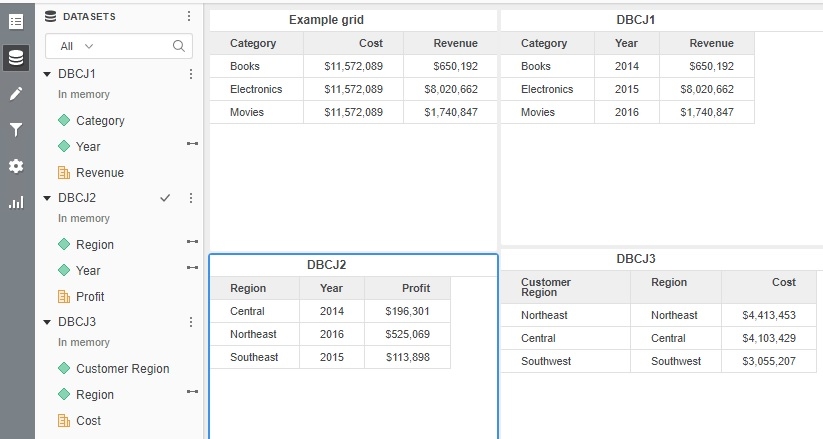
As shown in the example above, all data for cost is aggregated together and shown for every row of a category.
CAUSE
This is the default behavior when joining across unrelated attributes. In the example above, customer region and region are both unrelated to category. The datasets have filters so only some combinations can be seen. However, Strategy cannot know if these combinations are the only valid ones. With unfiltered datasets all data for all regions show up for all categories, providing very different behavior. To avoid data integrity issues from the lack of knowledge of the full possible set of combinations in the database, unrelated attributes are not used for joining data.
ACTION
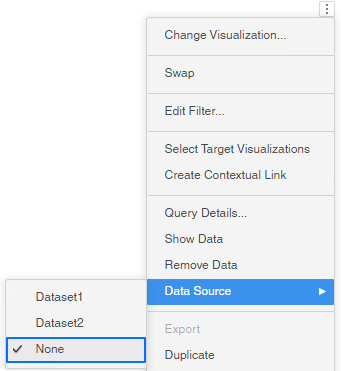
This behavior is controllable through both a VLDB property and through advanced properties in a dossier. This setting, Join Behavior, is accessed from the Dossier Properties dialog.
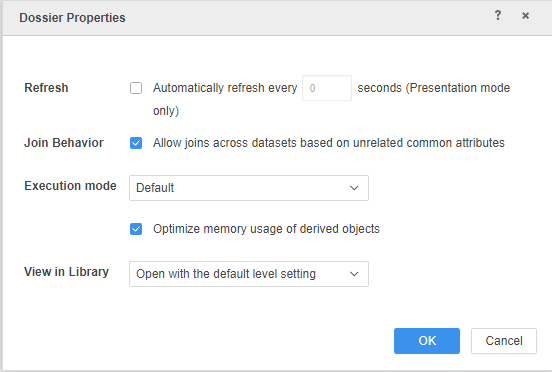
This property is also available in the analytical engine VLDB properties of a project in project configuration. If the Allow option for Join Behavior is enabled, joins can occur through unrelated attributes. In the example above this allows region to join through year to get to category and produces the results shown below.
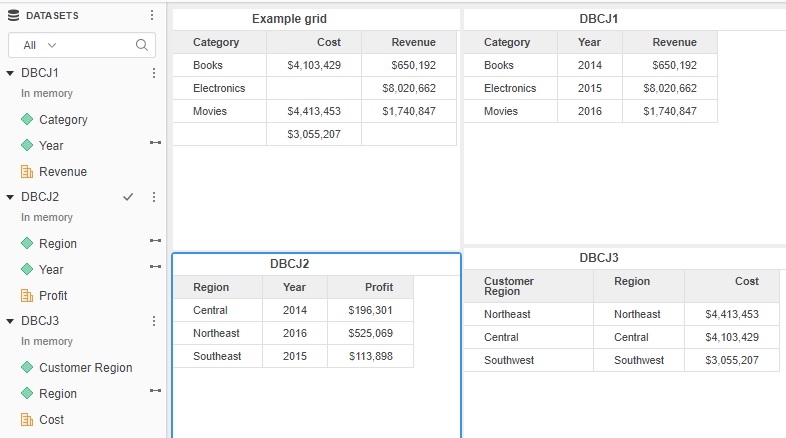
As you can see, the cost values are only seen alongside the categories that line up with the combinations from the other datasets, with one not mapped to any category as there is no southwest region/year combination.
Let's dig a little bit deeper with another example and interaction of the Join Behavior setting with the Data Source property of visualization:
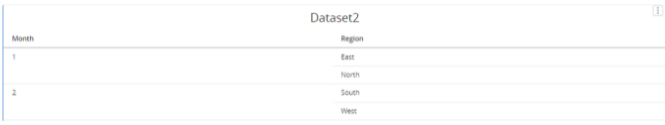
- Create a dossier with two datasets and pay attention to the respective data for each dataset.
- In Dataset1, Region and City have a one-to-many relation and they are not related to Month.
- In Dataset2, Month is not related to Region. In two datasets, Month and Region are linked.
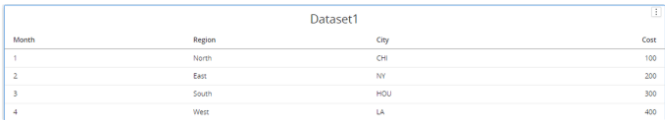
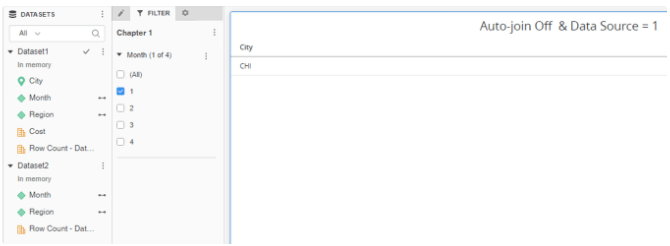
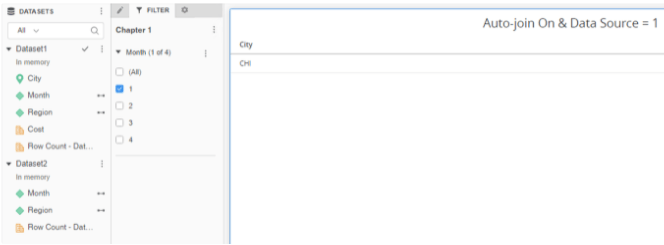
- Next, create a visualization and put City (from Dataset1) on the grid and Month (from Dataset1) in the filter and only select 1.
Example1: Join Behavior = unchecked; Data Source = Dataset1
This is actually a case where the data is sourced from single dataset. The filter on Month = 1 is applied on Dataset1 and returns one row.
The query is:
select [City]@[City] 2from Dataset1 3with Table Join Tree: [F_Dataset1.xlsxCBC28B2717BEA97AD201651654914916]<[Month]@[Month] in (1)>
In this case, the data source is Dataset2 and data needs to extend the attribute City from Dataset1. With Data Behavior disabled, Dataset2 will not directly join Dataset1. So instead, it joins the relation <Region, City> to extend the attribute City. As a result, two rows returned.

The query is:
select	([Month]@[Month]) as ([Month]@[Month]),
	[Month]@[Month]
from	Dataset2
with Table Join Tree: 	[L_MONTH]
to	Ex6_tempcube1

select	[Month]@[Month]
from	Ex6_tempcube1
where	[Month]@[Month] in (1)
to	Ex6_tempcube0

select	[Region]@[Region]
from	Dataset2
with Table Join Tree: 	[F_Dataset2.xlsxCBC28B2717BEA9CA8504519766776234]<<Month> in (Ex6_tempcube0)>
to	Ex6_tempcube2

select	*
from	Left Outer Join(
	                Ex6_tempcube2,
	                RELATION0-<Region, City>
	               ) on Region
to	Ex6_tempcube3
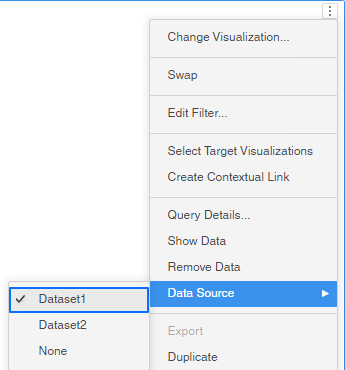
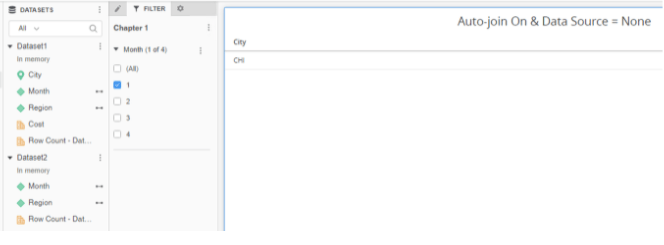
In this case, the data source is None and you can assume there is a third dataset which only has attributes on the grid. So in other words, Dataset3 only has one attribute that is City. City is not related to Month, so with Join Behavior disabled, there is no way to extend Dataset3(i.e. City) to the filter attribute (i.e. Month). As a result, the filter is ignored.
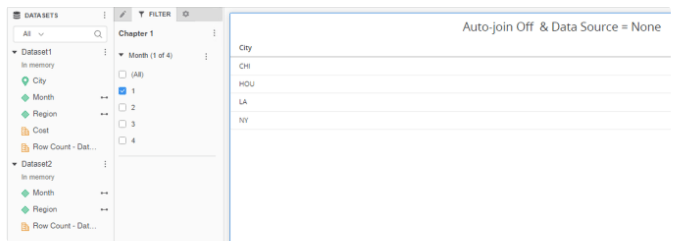
The query is:
select	[City]@[City]
from	Document
This is still a single source case so with Join Behavior enabled, the results and query are the same as Example1.
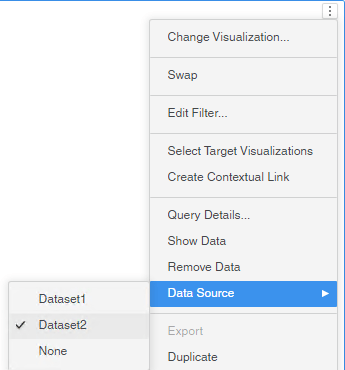
Example5: Join Behavior = checked; Data Source = Dataset2
With Join Behavior enabled, Dataset2 first joins the relation <Region, City> and then joins Dataset1 on the common attributes, City and Region.
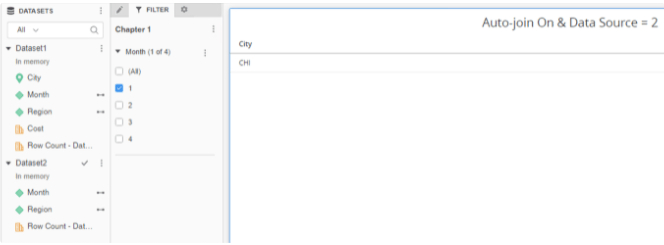
The query is:
select	([Month]@[Month]) as ([Month]@[Month]),
	[Month]@[Month]
from	Dataset2
with Table Join Tree: 	[L_MONTH]
to	Ex12_tempcube2

select	[Month]@[Month]
from	Ex12_tempcube2
where	[Month]@[Month] in (1)
to	Ex12_tempcube0

select	[Region]@[Region]
from	Dataset2
with Table Join Tree: 	[F_Dataset2.xlsxCBC28B2717BEA9CA8504519766776234]<<Month> in (Ex12_tempcube0)>
to	Ex12_tempcube3

select	*
from	Left Outer Join(
	                Ex12_tempcube3,
	                RELATION0-<Region, City>
	               ) on Region
to	Ex12_tempcube4

select	([Month]@[Month]) as ([Month]@[Month]),
	[City]@[City],
	[City]@[Latitude of City],
	[City]@[Longitude of City],
	([Region]@[Region]) as ([Region]@[Region])
from	Dataset1
with Table Join Tree: 	[F_Dataset1.xlsxCBC28B2717BEA97AD201651654914916]
to	Ex12_tempcube5

select	*
from	Left Outer Join(
	                Ex12_tempcube4,
	                Ex12_tempcube5
	               ) on City, Region
to	Ex12_tempcube6
With auto-join on, Dataset3 (i.e. City) can join Dataset1 on the common attribute City and apply the filter to Month.
The query is:
select	[City]@[City]
from	Document
to	Ex1_tempcube1

select	([Month]@[Month]) as ([Month]@[Month]),
	[City]@[City],
	[City]@[Latitude of City],
	[City]@[Longitude of City]
from	Dataset1
with Table Join Tree: 	[F_Dataset1.xlsxCBC28B2717BEA97AD201651654914916]
to	Ex1_tempcube2

select	*
from	Left Outer Join(
	                Ex1_tempcube1,
	                Ex1_tempcube2
	               ) on City
to	Ex1_tempcube3

select	[City]@[City],
	([Month]@[Month]) as ([Month]@[Month]),
	[Month]@[Month]
from	Ex1_tempcube3
to	Ex1_tempcube4

select	[City]@[City]
from	Ex1_tempcube4
where	[Month]@[Month] in (1)
to	Ex1_tempcube0