EducationSoftwareStrategy.com
StrategyCommunity

Knowledge Base

Product

Community

Knowledge Base

TopicsBrowse ArticlesDeveloper Zone

Product

Download SoftwareProduct DocumentationSecurity Hub

Education

Tutorial VideosSolution GalleryEducation courses

Community

GuidelinesGrandmastersEvents
x_social-icon_white.svglinkedin_social-icon_white.svg
Strategy logoCommunity

© Strategy Inc. All Rights Reserved.

LegalTerms of UsePrivacy Policy
  1. Home
  2. Topics

KB439600: Showing Total on Dossier Using Waterfall Chart Visualization Displays a Total for Each Attribute Instead of Just the Overall Total


Community Admin

• Strategy


This document shows how to get the Total for the “Waterfall Chart” visualization downloaded from https://community.microstrategy.com/s/article/Waterfall-Chart because the one that is provided with the visualization renders total for each category while the screen shot on the gallery page shows total for the last value only. Tested on 10.9 and 10.10 Dossiers.

Starting with the release of Strategy ONE (March 2024), dossiers are also known as dashboards.
SYMPTOM:
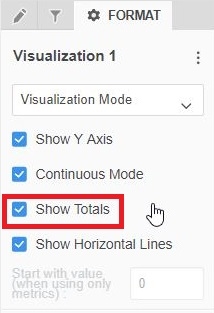
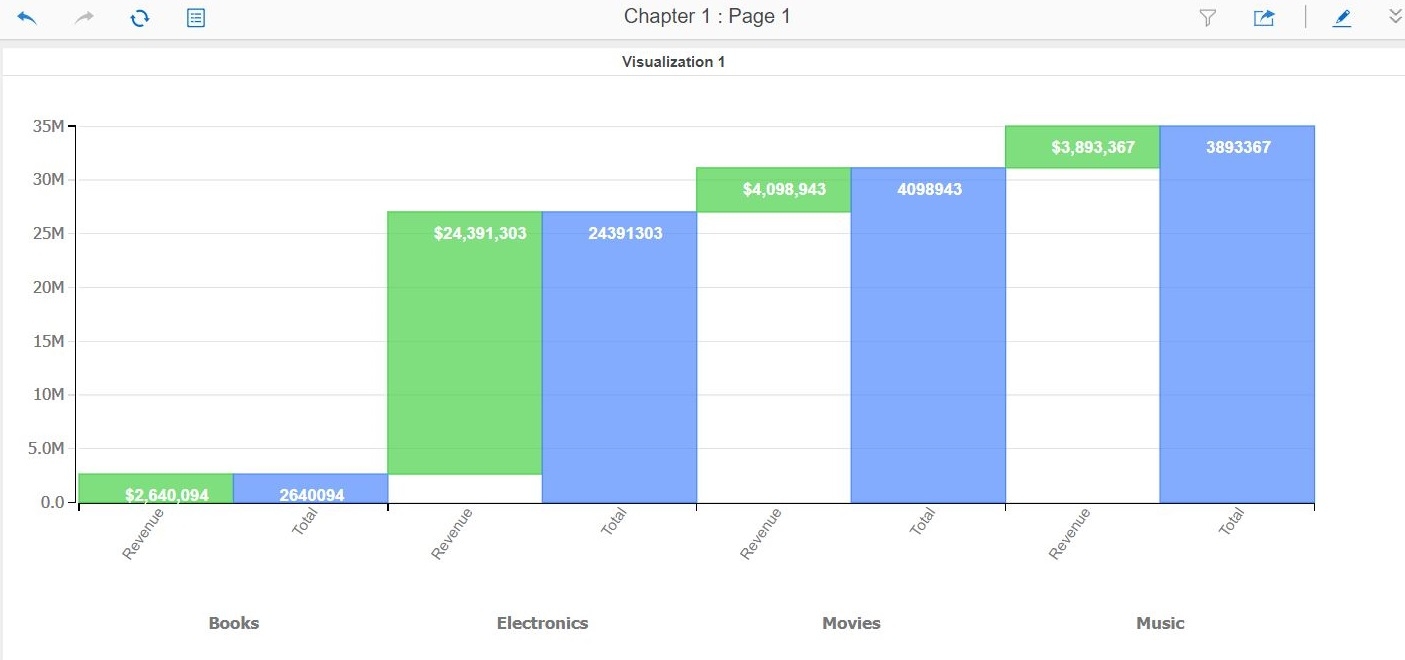
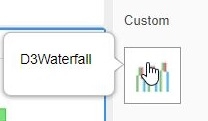
Using the "Waterfall Chart" visualization from the gallery and turning on totals from the format menu renders total for each category instead of just one for all the category attributes.
STEPS TO REPRODUCE:

  1. Download and use the "Waterfall Chart" visualization from the gallery https://community.Strategy.com/s/article/Waterfall-Chart and install.
  2. Create a new Dossier.
  3. Used dataset "Category Sales Report" from "Strategy Tutorial" project.
  4. Select Waterfall Chart from custom section of Gallery (it is under the name "D3Waterfall").
  5. Added "Category" to Attribute field and "Revenue" to the Metric field.
  6. Click on the format panel tab and select "Visualization Mode" from the first drop down menu. Then select the check box for "Show Totals".
ka0PW0000001JRdYAM_0EM44000000YQnm.jpeg


ka0PW0000001JRdYAM_0EM44000000YQnr.jpeg

WORKAROUND:
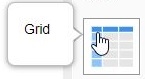
1. Convert the VI to a Grid VI.

ka0PW0000001JRdYAM_0EM44000000YQn3.jpeg

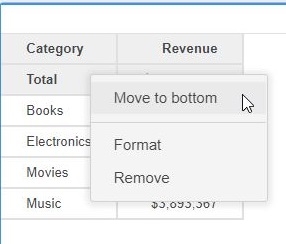
2. Right click on the attribute title (in our example Category) and select "Show Totals", "Total"

ka0PW0000001JRdYAM_0EM44000000YQn8.jpeg

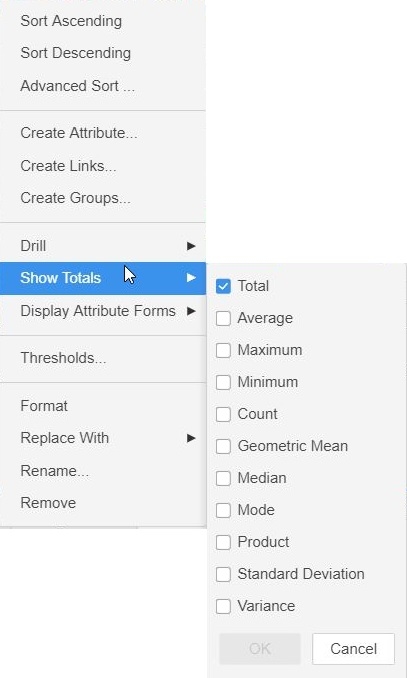
3. Right click on Total and select "Move to bottom" if it shows up as the first row.

ka0PW0000001JRdYAM_0EM44000000YQnD.jpeg

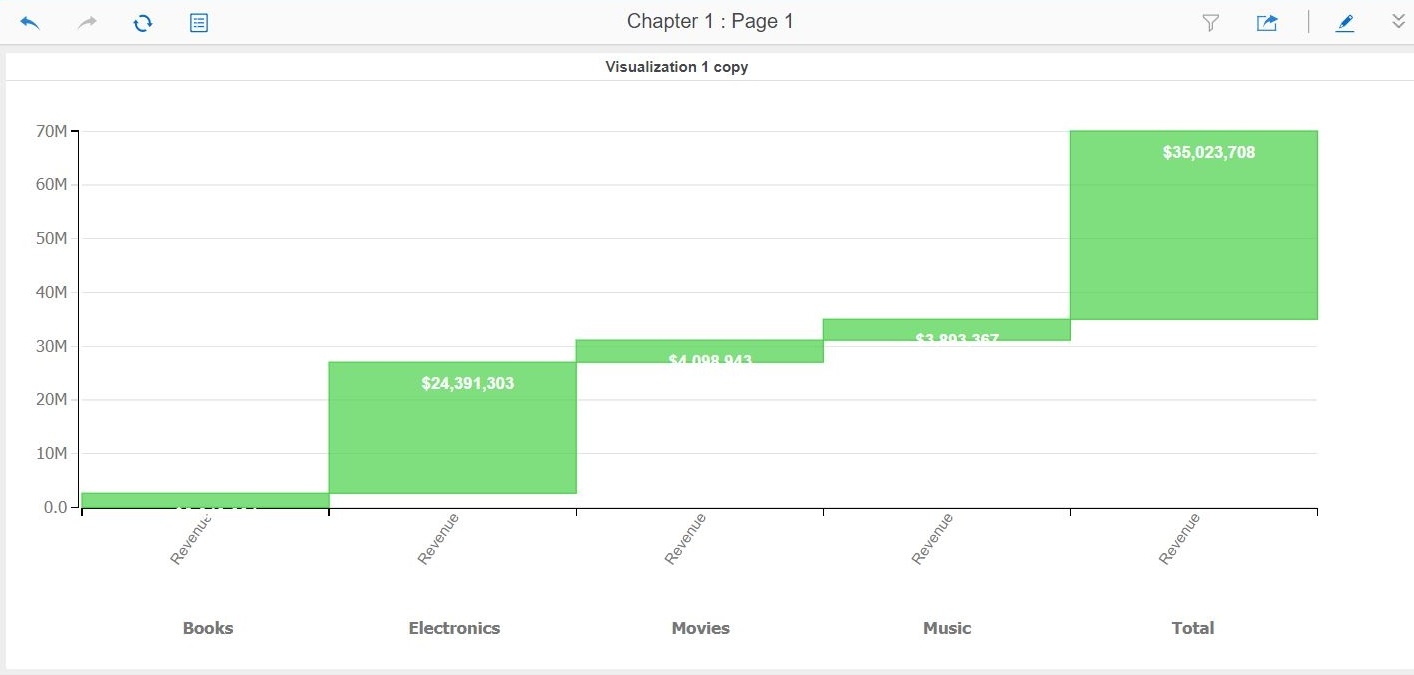
4. Then switch back to the Waterfall VI which will now have a Total section.
 

ka0PW0000001JRdYAM_0EM44000000YQmt.jpeg

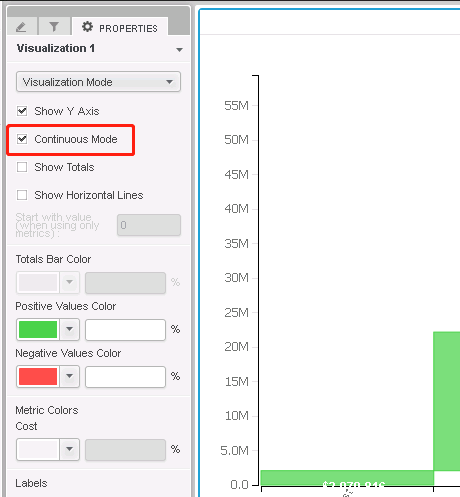
5. In Visualization Mode, check the option Continuous Mode.This option might be unchecked from Grid to Waterfall.

ka0PW0000001JRdYAM_0EM44000000WWYS.png

The result:

ka0PW0000001JRdYAM_0EM44000000YQnX.jpeg

Article reference number KB439600


Comment

0 comments

Details

Knowledge Article

Published:

February 6, 2018

Last Updated:

March 21, 2024