Starting with the release of Strategy ONE (March 2024), dossiers are also known as dashboards.
DISCUSSION
Starting in Strategy 10.10 it is possible for users to view the query details of a visualization in a dossier. This feature allows users to see the MCE (multi-cube engine) logic that is used for a visualization. In other words, it allows users to see which dataset each object in a visualization is sourced from and how the data is joined between multiple datasets when datablending is used in a visualization.
Consider an example where 2 datasets are contained in a dossier, and a visualization in the dossier contains objects from both datasets. In this example the datasets are DBRM1 and DBRM2, and the objects in the visualization are the attributes Year and Category and the metrics DM1 and DM2. The query details for this visualization are seen below:
select	[Category]@[CATEGORY_ID],
	[Category]@[CATEGORY_DESC],
	[Year]@[YEAR_ID],
	[Revenue] as [Revenue],
	sum([Revenue])@{[Category],[Year]} as [DM1]
from	DBRM1
to	Ex7_tempcube0

select	[Category]@[CATEGORY_ID],
	[Category]@[CATEGORY_DESC],
	[Year]@[YEAR_ID],
	sum((sum([Revenue])@{[Category],[Year]} / [Revenue])) as [DM2]
from	DBRM2
to	Ex7_tempcube1

select	*
from	Full Outer Join(
	                Ex7_tempcube0,
	                Ex7_tempcube1
	               ) on Year, Category
to	Ex7_tempcube2

Drop	Ex7_tempcube0

Drop	Ex7_tempcube1

select	[Category]@[CATEGORY_ID],
	[Category]@[CATEGORY_DESC],
	[Year]@[YEAR_ID],
	[Revenue] as [Revenue],
	[DM1] as [DM1],
	[DM2] as [DM2]
from	Ex7_tempcube2

Drop	Ex7_tempcube2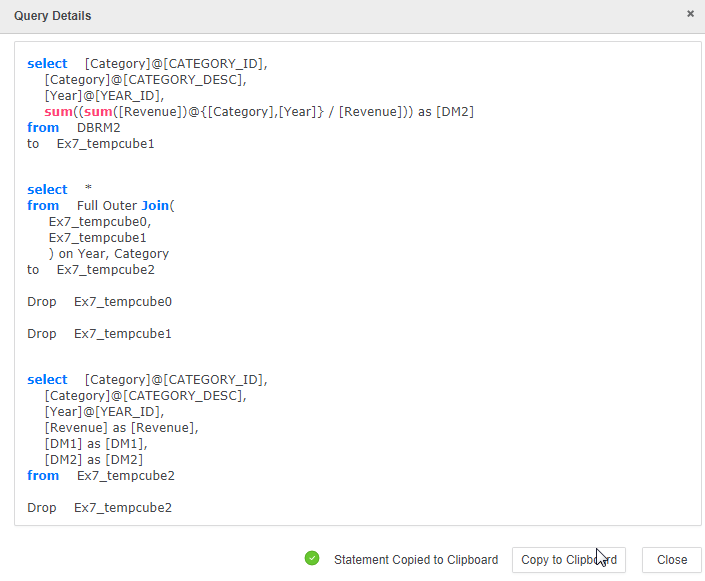
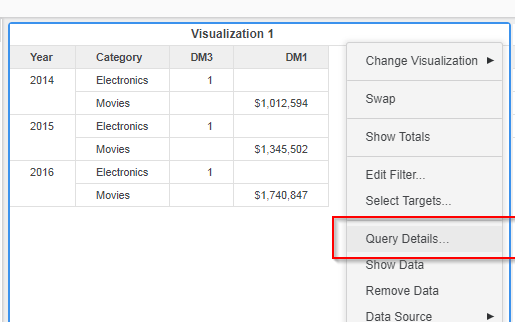
The query details can be accessed from the dropdown in the top right corner of a visualization.
KB440232