Starting with the release of Strategy ONE (March 2024), dossiers are also known as dashboards.
SYMPTOM
Certain data point is not plotted in Graph matrix in Dashboard/Dossier prior to Strategy Web 10.4.7 or 10.11.
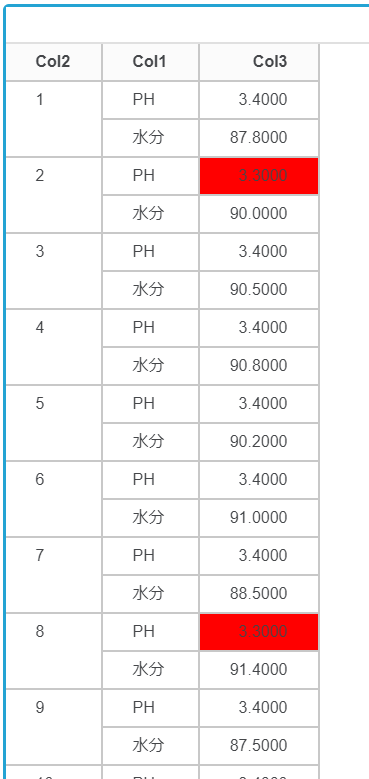
Below is sample data to reproduce this issue.
Notice the value marked as red.
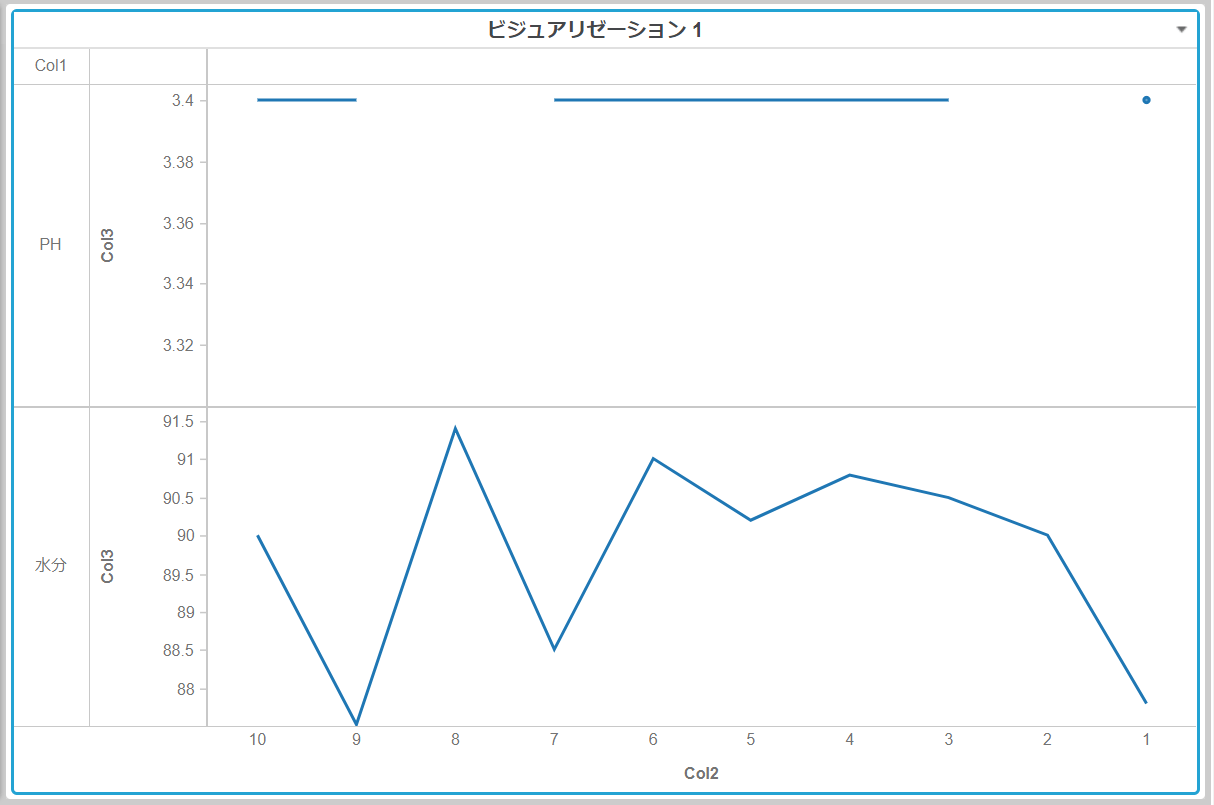
Set the visualization as Graph Matrix-Line.
Certain points(above red value) are not plotted so that one line in below Graph Matrix looks broken.
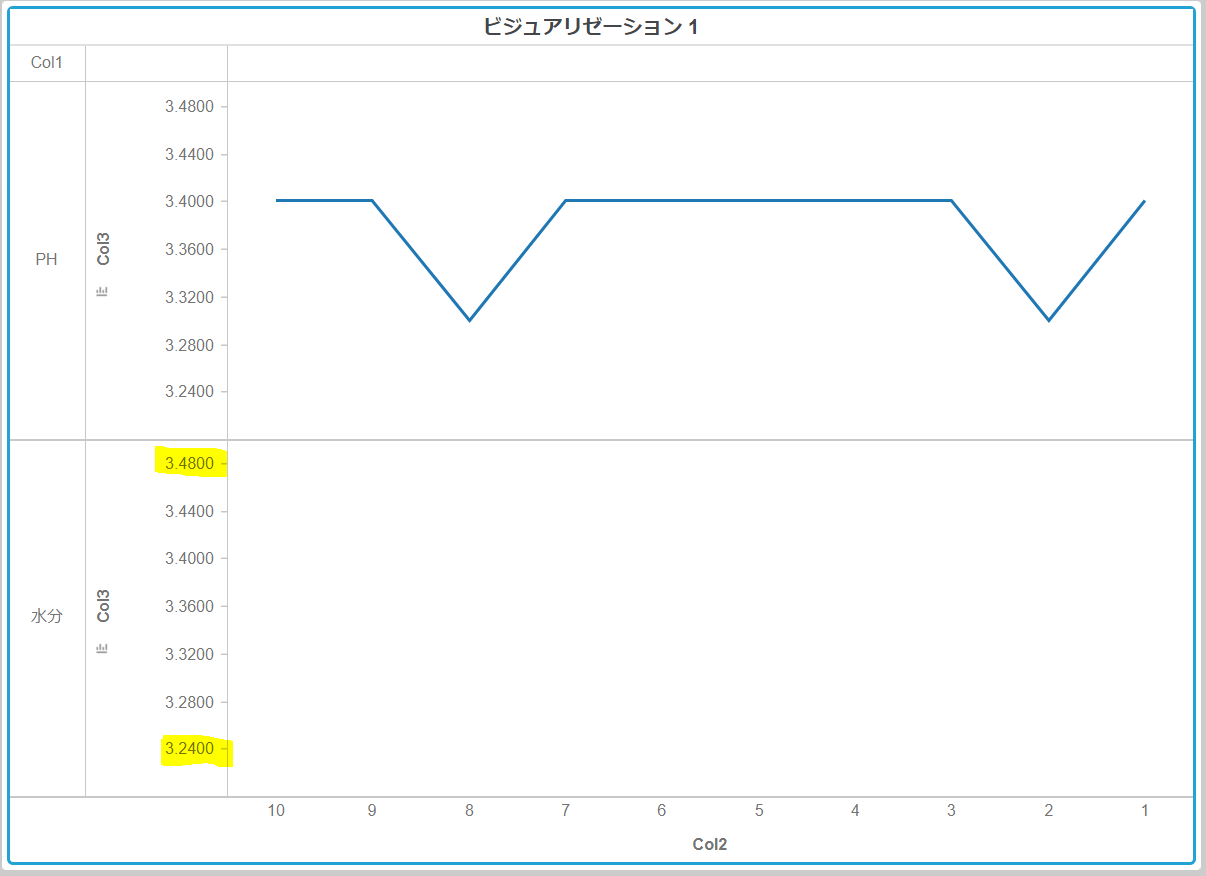
Change the minimum value of axis to smaller than 3.3. The points are rendered correctly.
However this minimum value would take effect for all sub graphs.
So this might not be a valid workaround especially when there are many sub graphs with different data ranges.
CAUSE
This is a known issue prior to Strategy Web 10.4.7 or 10.11.
ACTION
The issue has been fixed in 10.4HF7 and 10.11, and also above.
Please upgrade the product or install hot fix to take the advantage.
The Strategy Internal Reference Number for the issue discussed in this technical note is DE80903, DE84390.
Article Reference Number: KB440250
KB440250
