EducationSoftwareStrategy.com
StrategyCommunity

Knowledge Base

Product

Community

Knowledge Base

TopicsBrowse ArticlesDeveloper Zone

Product

Download SoftwareProduct DocumentationSecurity Hub

Education

Tutorial VideosSolution GalleryEducation courses

Community

GuidelinesGrandmastersEvents
x_social-icon_white.svglinkedin_social-icon_white.svg
Strategy logoCommunity

© Strategy Inc. All Rights Reserved.

LegalTerms of UsePrivacy Policy
  1. Home
  2. Topics

KB44100: The maximum number of categories in a Histogram graph is 9999 as opposed to 16000 in MicroStrategy Web 9.3.1.


Community Admin

• Strategy


The maximum number of categories in a Histogram graph is 9999 as opposed to 16000 in MicroStrategy Web 9.3.1.

SYMPTOM:
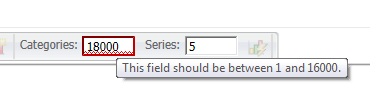
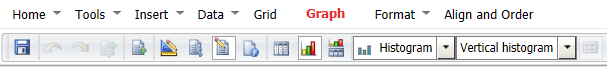
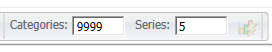
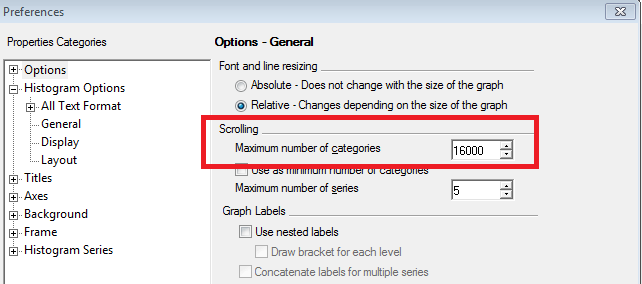
In Strategy Web 9.3.1, when selecting the number of categories per page in a Histogram graph the maximum value is automatically set to 9999 preventing users to set it to the 16000 limit visible in Strategy Desktop 9.3.1.

ka04W000000Oh5iQAC_0EM4400000026cU.png

 
STEPS TO REPRODUCE:

  • In Strategy Tutorial create a new dashboard.
  • Insert the Category Sales Report as a dataset.
  • Create a new grid and insert Category and Revenue.
  • Right click the grid and change the view mode to graph mode as shown below:
ka04W000000Oh5iQAC_0EM4400000026cS.png
  • Run in editable mode.
  • Select the Graph tab from the toolbar and change the graph type to Histogram:
ka04W000000Oh5iQAC_0EM4400000026cM.png
  • Try to input a value higher than 16000 in the Categories field as shown below:
ka04W000000Oh5iQAC_0EM4400000026cU.png
  • Notice that the limit is set to be 16000.
  • Now input any value between 10000 and 16000 inclusive and click on apply as shown below:
ka04W000000Oh5iQAC_0EM4400000026cT.png
  • Now click the graph again to show the tool bar and notice that the value is set to 9999.
ka04W000000Oh5iQAC_0EM4400000026cN.png
  • Now edit the document in Strategy Desktop 9.3.1.
  • Right click the grid and select Graph Options as shown below:
ka04W000000Oh5iQAC_0EM4400000026cL.png
  • Under Options - General note that the Maximum number of Categories possible is 16000 as shown below:
ka04W000000Oh5iQAC_0EM4400000026cR.png
  • Notice that this option is not being applied correctly in the Strategy Web 9.3.1.

 
CAUSE:
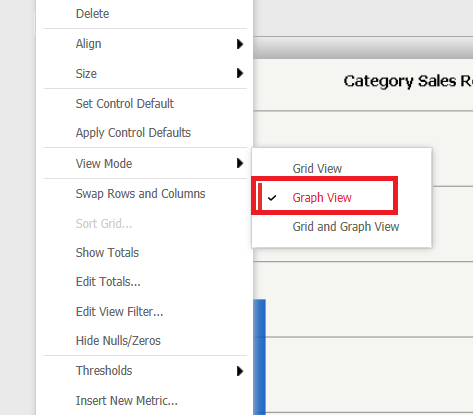
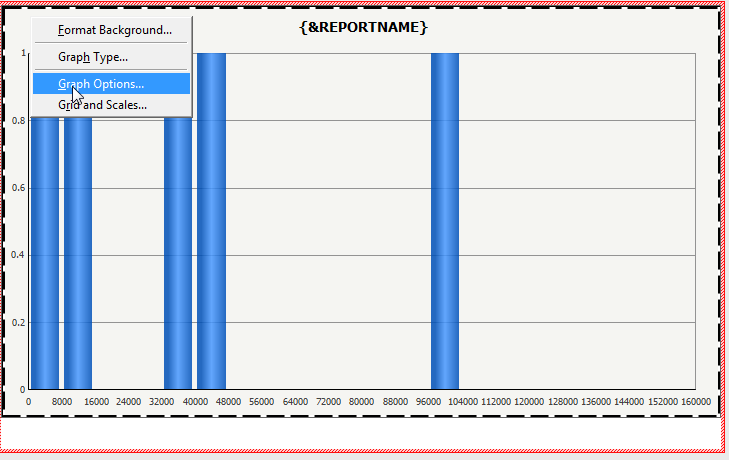
This is working as designed in Strategy Web 9.3.1. The Histogram graph is designed to group data frequencies in a Bar graph format, therefore one row does not equal one category. The current limit of categories specifically for the histogram graph in the backend is 9999. However the tooltip displaying the range limits does not reflect this histogram-specific limit.
 
ACTION:
Contact Strategy Technical Support for an update on this issue.
 
WORKAROUND:
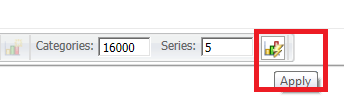
Select the maximum value of 9999 and the rest of the categories will be displayed in several pages of the Histogram graph.


Comment

0 comments

Details

Knowledge Article

Published:

June 5, 2017

Last Updated:

June 5, 2017