SYMPTOM
When exporting a report services document grid in outline mode to Excel, if there are more than eight outline levels, Excel will analyze the report wrongly, especially regarding format and will omit some data values if multiple values exist at the same level.
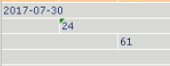
An example is shown here, where at Level 3, there are data values 61 and 62.
The Report Services Document below has 9+ levels. When exported to Excel, only value 61 is visible at level 3 is shown in the Excel file.
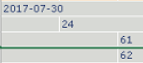
The Report Services Document below has eight levels. When exported to Excel, both values 61 and 62 are visible at level 3 in the Excel file.
CAUSE
This is a limitation of Microsoft Excel. Excel does not allow outline levels great than 8.
WORKAROUND
Users can create outline mode Grids in Strategy that are eight levels or less.
Otherwise, if a Report Services Document has outline levels greater than 8, set the outline to group the data for the levels beyond 8 to the 8th level. Meaning for data that is at level 9 or 10 will roll up to be at level 8 as well.
This will require reviewing and updating the dataset to have specific values and hierarchical structures created and manipulated. This will have to be addressed on a case by case basis.
See screenshot for reference:
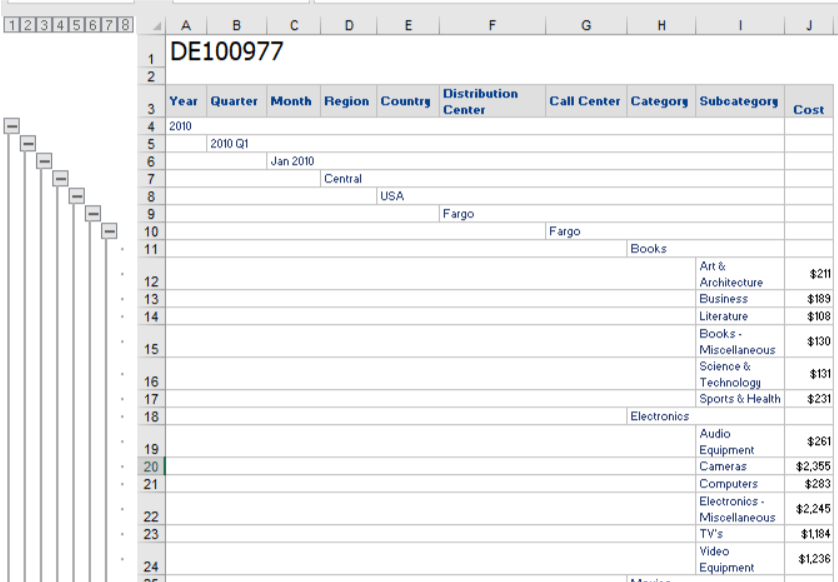
In the example above, but Subcategory and Cost are on the same level as an 8 level Report Services Document exported to Excel. This allows all data to be exported and visible in Excel and without distortion or data being omitted.
KB441975