Starting with the release of Strategy ONE (March 2024), dossiers are also known as dashboards.
SYMPTOM
For a dossier using Live Intelligent Cube, filter for conditional metric is also applied to other metric if all the metrics and attributes come from same dataset.
STEPS TO REPRODUCE
1. This example uses Strategy Tutorial project to demonstrate the problem and the fix.
2. Create a Data Import Live Intelligent Cube with following structure and nne of the tables have any relationship defined.

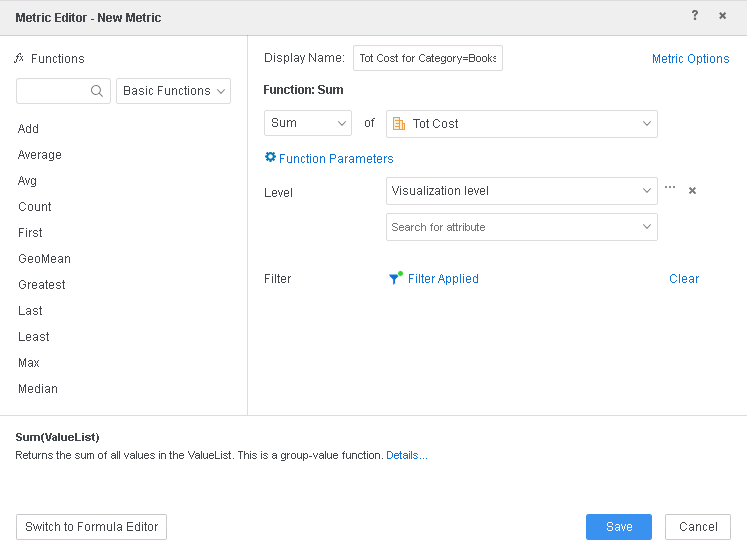
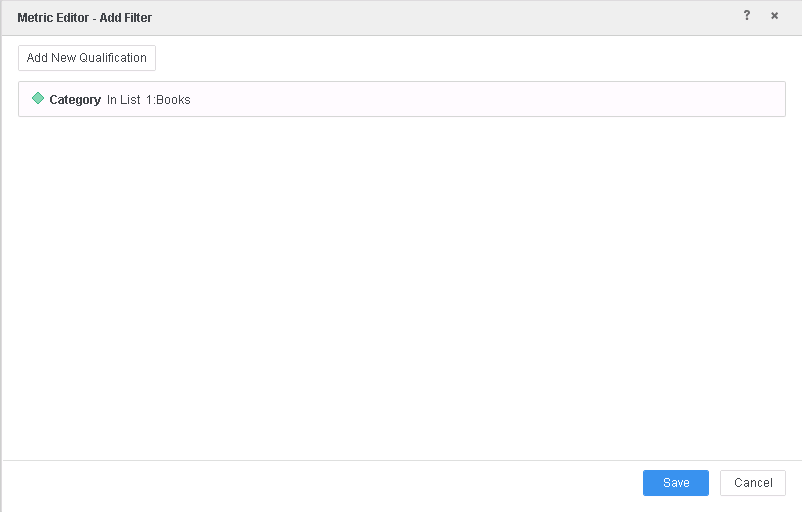
3. Create a new derived metric with following expression and also apply a filter as specified below: Sum([Tot Cost]){~+}< ;@2;->
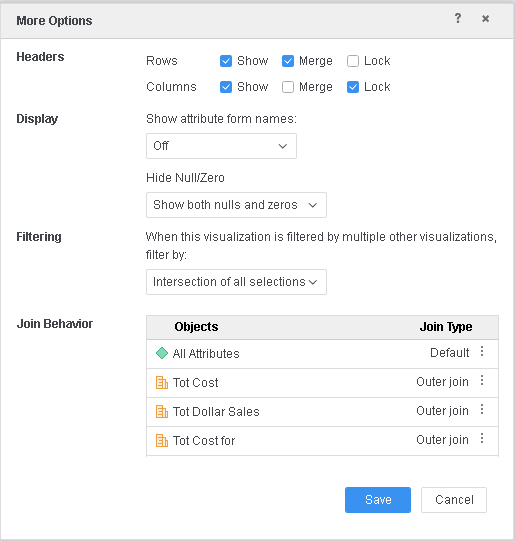
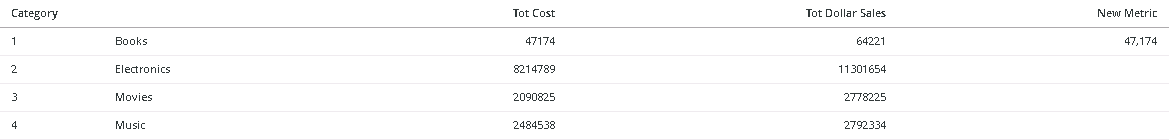
4. Put Category attribute, Tot Cost, Tot Dollar Sales and new metric (created in step above) on visualization and make sure that all the metrics are set to Outer Join.
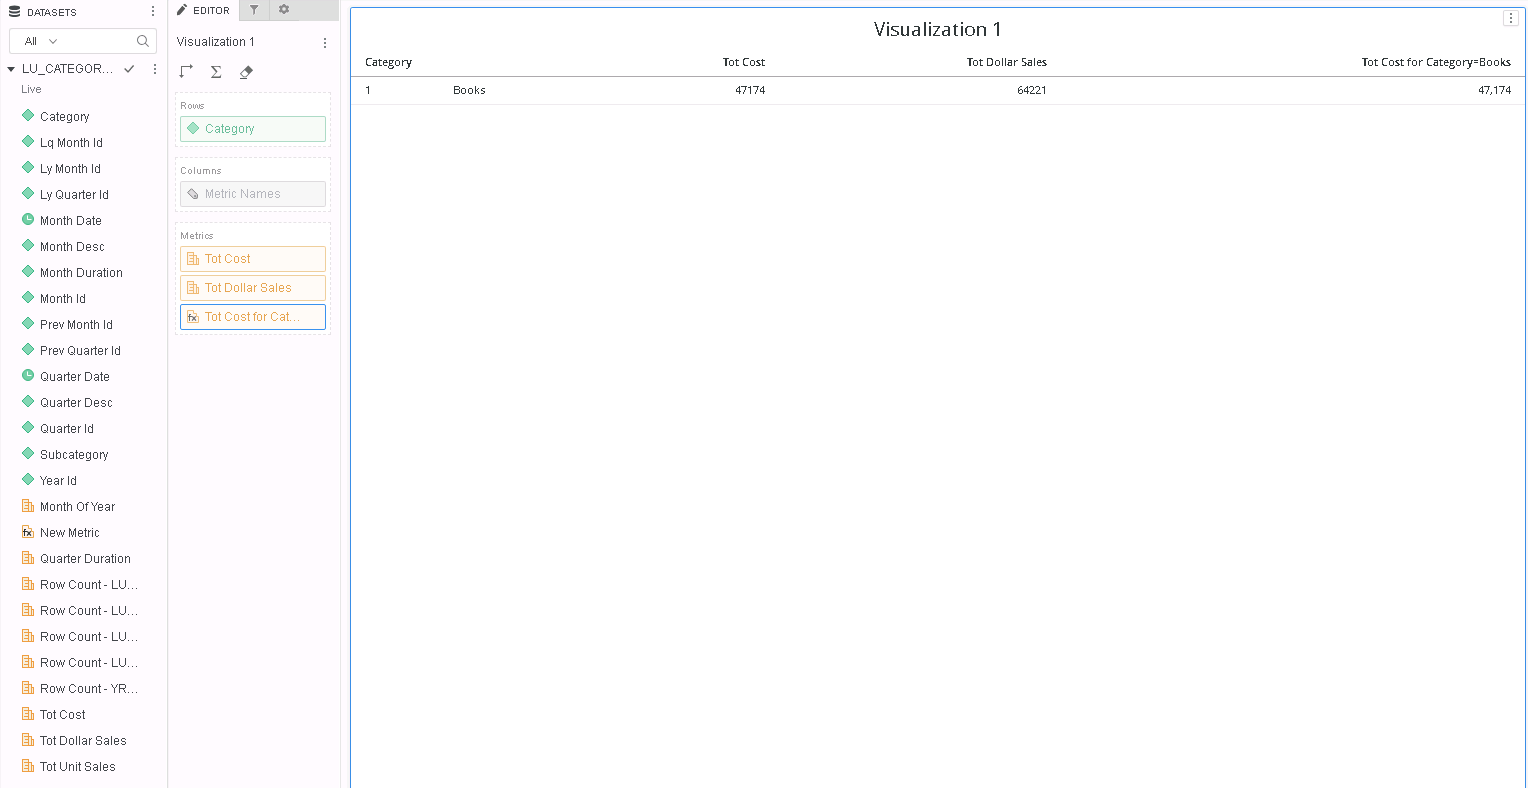
5. Note that there is only 1 row with Category = Books even though there is metric data available for other categories for Tot Cost, Tot Dollar Sales metrics.

6. Go to Query Details and note that the the filter (Category=Books) that was meant to be applied to only new metric, is also applied to other metrics (highlighted in red below)
*********   Visualization Summary Start  **********
Time Spent: 0.092 sec(s)
Query Execution Start Time: 2/4/2019 4:36:18 PM
Query Execution End Time: 2/4/2019 4:36:19 PM

Note: The total 'Time Spent' above may be greater than the summation of the individual step execution times below.
There are preparation tasks for each step that are not individually measured.
*********   Visualization Summary End    **********


************   Individual Step Start   ************
Query Engine Execution Start Time:		2/4/2019 4:36:18 PM
Query Engine Execution Finish Time:		2/4/2019 4:36:18 PM

Query Generation Time:		0:00:00.00
Total Elapsed Time In Query Engine:		0:00:00.10
	Sum of Query Execution Time:		0:00:00.02
	Total Data Fetching and Processing Time:		0:00:00.00
		Total Data Transfer from Datasource(s) Time:		0:00:00.00
	Total Analytical Processing Time:		0:00:00.00
	Total Other Processing Time:		0:00:00.02
Projected execution time improvement (%) if executed in Parallel Execution mode:	Parallel SQL Execution is not supported for this report

???		0:00:00.00
???		0:00:00.00
Total Cube Publish Time		0:00:00.00

Number of Rows Returned:		1
Number of Columns Returned:		5
Number of Temp Tables:		1

Total Number of Passes:		4
Number of Datasource Query Passes:		4
Number of Analytical Query Passes:		0

DB User:		dashboard_tutorial
DB Instance:		dashboard_tutorial

Tables Accessed:
YR_CATEGORY_SLS
LU_CATEGORY

SQL Statements:

Pass0 - 	Query Pass Start Time:		2/4/2019 4:36:18 PM
	Query Pass End Time:		2/4/2019 4:36:18 PM
	Query Execution:	0:00:00.01
	Data Fetching and Processing:	0:00:00.00
	  Data Transfer from Datasource(s):	0:00:00.00
	Other Processing:	0:00:00.02
select	a11.CATEGORY_ID  CATEGORY_ID,
	sum(a11.TOT_COST)  WJXBFS1,
	sum(a11.TOT_DOLLAR_SALES)  WJXBFS2,
	sum(a11.TOT_COST)  WJXBFS3
into ##ZZT4ECWZZ8MMD000
from	dbo.YR_CATEGORY_SLS	a11
where	a11.CATEGORY_ID in (1)
group by	a11.CATEGORY_ID

Pass1 - 	Query Pass Start Time:		2/4/2019 4:36:18 PM
	Query Pass End Time:		2/4/2019 4:36:18 PM
	Query Execution:	0:00:00.00
	Data Fetching and Processing:	0:00:00.00
	  Data Transfer from Datasource(s):	0:00:00.00
	Other Processing:	0:00:00.02
	Rows selected: 1
select	pa12.CATEGORY_ID  CATEGORY_ID,
	a13.CATEGORY_DESC  CATEGORY_DESC,
	pa12.WJXBFS1  WJXBFS1,
	pa12.WJXBFS2  WJXBFS2,
	pa12.WJXBFS3  WJXBFS3
from	##ZZT4ECWZZ8MMD000	pa12
	join	dbo.LU_CATEGORY	a13
	  on 	(pa12.CATEGORY_ID = a13.CATEGORY_ID)

Pass2 - 	Query Pass Start Time:		2/4/2019 4:36:18 PM
	Query Pass End Time:		2/4/2019 4:36:18 PM
	Query Execution:	0:00:00.00
	Data Fetching and Processing:	0:00:00.00
	  Data Transfer from Datasource(s):	0:00:00.00
	Other Processing:	0:00:00.00
[Populate Report Data]

Pass3 - 	Query Pass Start Time:		2/4/2019 4:36:18 PM
	Query Pass End Time:		2/4/2019 4:36:18 PM
	Query Execution:	0:00:00.00
	Data Fetching and Processing:	0:00:00.00
	  Data Transfer from Datasource(s):	0:00:00.00
	Other Processing:	0:00:00.02
drop table ##ZZT4ECWZZ8MMD000

[Analytical engine calculation steps:
	1.  Perform cross-tabbing
]

to  LU_CATEGORY LU_MONTH LU_QUARTER LU_SUBCATEG YR_CAT... (5 tables)_2
************   Individual Step End     ************


************   Individual Step Start   ************
Number of Rows Returned: 1
Time Spent: 0.005 sec(s)
Query Execution Start Time: 2/4/2019 4:36:18 PM
Query Execution End Time: 2/4/2019 4:36:19 PM

select	[Category]@[CATEGORY_ID],
	[Category]@[CATEGORY_DESC],
	[New Metric] as [New Metric],
	[Tot Dollar Sales] as [Tot Dollar Sales],
	[Tot Cost] as [Tot Cost]
from	LU_CATEGORY LU_MONTH LU_QUARTER LU_SUBCATEG YR_CAT... (5 tables)_2
************   Individual Step End     ************
*********   Visualization Summary Start  **********
Time Spent: 0.701 sec(s)
Query Execution Start Time: 2/4/2019 4:27:35 PM
Query Execution End Time: 2/4/2019 4:27:36 PM

Note: The total 'Time Spent' above may be greater than the summation of the individual step execution times below.
There are preparation tasks for each step that are not individually measured.
*********   Visualization Summary End    **********


************   Individual Step Start   ************
Query Engine Execution Start Time:		2/4/2019 4:27:27 PM
Query Engine Execution Finish Time:		2/4/2019 4:27:32 PM

Query Generation Time:		0:00:00.00
Total Elapsed Time In Query Engine:		0:00:05.48
	Sum of Query Execution Time:		0:00:00.01
	Total Data Fetching and Processing Time:		0:00:00.00
		Total Data Transfer from Datasource(s) Time:		0:00:00.00
	Total Analytical Processing Time:		0:00:00.00
	Total Other Processing Time:		0:00:03.74
Projected execution time improvement (%) if executed in Parallel Execution mode:	Parallel SQL Execution is not supported for this report

???		0:00:00.42
???		0:00:00.00
Total Cube Publish Time		0:00:00.00

Number of Rows Returned:		4
Number of Columns Returned:		5
Number of Temp Tables:		1

Total Number of Passes:		4
Number of Datasource Query Passes:		4
Number of Analytical Query Passes:		0

DB User:		dashboard_tutorial
DB Instance:		dashboard_tutorial

Tables Accessed:
YR_CATEGORY_SLS
LU_CATEGORY

SQL Statements:

Pass0 - 	Query Pass Start Time:		2/4/2019 4:27:30 PM
	Query Pass End Time:		2/4/2019 4:27:30 PM
	Query Execution:	0:00:00.00
	Data Fetching and Processing:	0:00:00.00
	  Data Transfer from Datasource(s):	0:00:00.00
	Other Processing:	0:00:00.10
select	a11.CATEGORY_ID  CATEGORY_ID,
	sum((Case when a11.CATEGORY_ID in (1) then a11.TOT_COST else NULL end))  WJXBFS1,
	sum(a11.TOT_DOLLAR_SALES)  WJXBFS2,
	sum(a11.TOT_COST)  WJXBFS3
into ##ZZTK2G8YLKYMD000
from	dbo.YR_CATEGORY_SLS	a11
group by	a11.CATEGORY_ID

Pass1 - 	Query Pass Start Time:		2/4/2019 4:27:30 PM
	Query Pass End Time:		2/4/2019 4:27:30 PM
	Query Execution:	0:00:00.00
	Data Fetching and Processing:	0:00:00.00
	  Data Transfer from Datasource(s):	0:00:00.00
	Other Processing:	0:00:00.03
	Rows selected: 4
select	pa12.CATEGORY_ID  CATEGORY_ID,
	a13.CATEGORY_DESC  CATEGORY_DESC,
	pa12.WJXBFS1  WJXBFS1,
	pa12.WJXBFS2  WJXBFS2,
	pa12.WJXBFS3  WJXBFS3
from	##ZZTK2G8YLKYMD000	pa12
	join	dbo.LU_CATEGORY	a13
	  on 	(pa12.CATEGORY_ID = a13.CATEGORY_ID)

Pass2 - 	Query Pass Start Time:		2/4/2019 4:27:30 PM
	Query Pass End Time:		2/4/2019 4:27:32 PM
	Query Execution:	0:00:00.00
	Data Fetching and Processing:	0:00:00.00
	  Data Transfer from Datasource(s):	0:00:00.00
	Other Processing:	0:00:01.56
[Populate Report Data]

Pass3 - 	Query Pass Start Time:		2/4/2019 4:27:32 PM
	Query Pass End Time:		2/4/2019 4:27:32 PM
	Query Execution:	0:00:00.00
	Data Fetching and Processing:	0:00:00.00
	  Data Transfer from Datasource(s):	0:00:00.00
	Other Processing:	0:00:00.02
drop table ##ZZTK2G8YLKYMD000

[Analytical engine calculation steps:
	1.  Perform cross-tabbing
]

to  LU_CATEGORY LU_MONTH LU_QUARTER LU_SUBCATEG YR_CAT... (5 tables)_0
************   Individual Step End     ************


************   Individual Step Start   ************
Number of Rows Returned: 4
Time Spent: 0.501 sec(s)
Query Execution Start Time: 2/4/2019 4:27:35 PM
Query Execution End Time: 2/4/2019 4:27:36 PM

select	[Category]@[CATEGORY_ID],
	[Category]@[CATEGORY_DESC],
	[New Metric] as [New Metric],
	[Tot Dollar Sales] as [Tot Dollar Sales],
	[Tot Cost] as [Tot Cost]
from	LU_CATEGORY LU_MONTH LU_QUARTER LU_SUBCATEG YR_CAT... (5 tables)_0
************   Individual Step End     ************